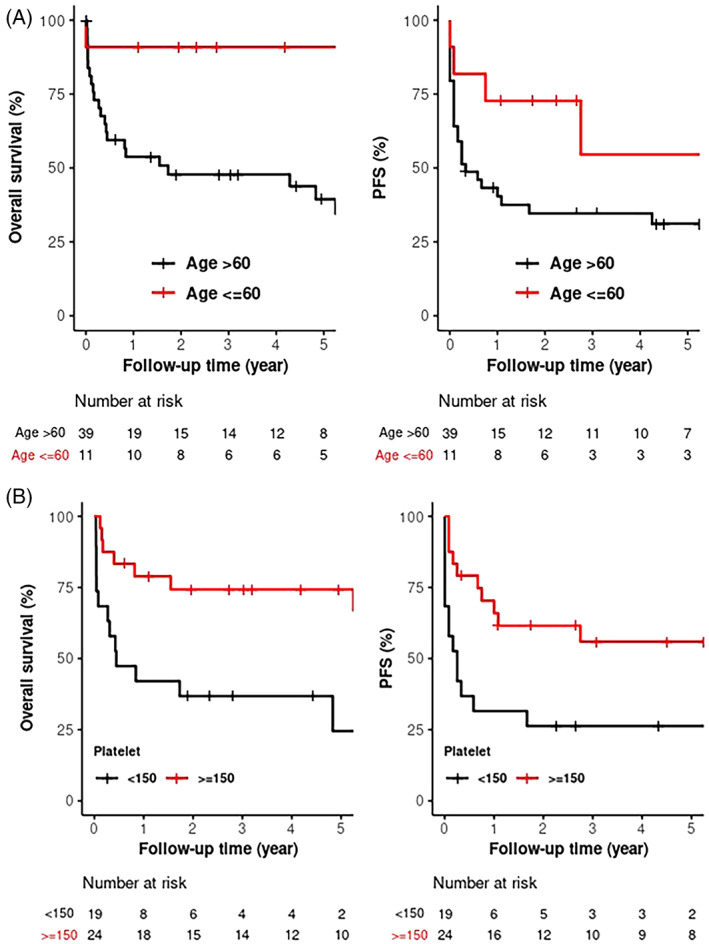
FIGURE 4.

(A) Kaplan–Meier survival curves showing mOS (p = .002) and mPFS (p = .021) for age ≤ 60 versus age > 60 at diagnosis. (B) Kaplan–Meier survival curves showing mOS (p = .005) and mPFS (p = .01) for platelet count <150 versus platelet count ≥150 at diagnosis [Color figure can be viewed at wileyonlinelibrary.com]
