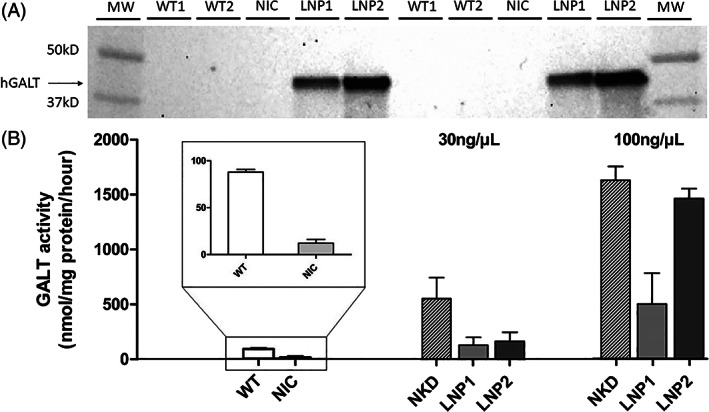
FIGURE 2.

hGALT expression and activity in 5 dpf CG zebrafish (galt KO) after single dose hGALT mRNA injection (100 ng/μl) at the one‐cell stage. A: Western blot analysis: Non‐injected WT and CG zebrafish (galt KO) controls present no band, which indicates that the antibody is specific for hGALT. Samples were loaded in duplicate (n = 150 per sample). B: GALT activity (nmol/mg protein/h), results are presented as mean ± SEM. All samples (n = 3 per experimental group, on average 30 zebrafish/sample), were measured in duplicate. MW, molecular weight ladder; WT, wildtype; NIC, non‐injected CG zebrafish (galt KO) control; NKD, naked mRNA injected CG zebrafish (galt KO); LNP1, LNP1‐packaged hGALT mRNA injected CG zebrafish (galt KO); LNP2, LNP2‐packaged hGALT mRNA injected CG zebrafish (galt KO)
