
Fig. 2.
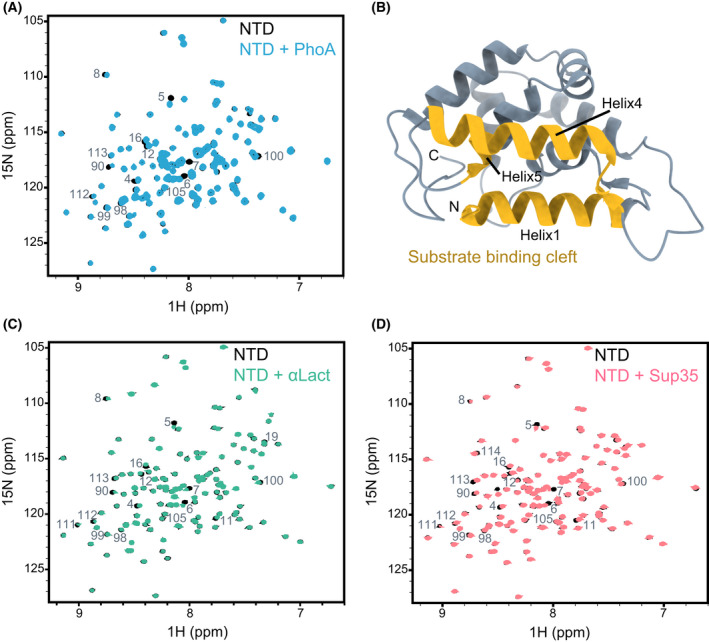
Interaction of Hsp104 NTD with client proteins. (A) 1H‐15N HSQC spectra of 200 µm NTD alone (black), and in complex with 400 µm unfolded PhoA protein fragment, resides 349–471 (blue). (B) Cartoon representation of Hsp104 NTD X‐ray structure (PDB 5U2U [69]), with the residues found in our NMR experiments to bind to client proteins highlighted in yellow. The largest CSPs were observed for residues D3–S23 (Helix1), T87–N105 (Helix4) and I111–L115 (Helix5). The figure was generated with UCSF ChimeraX. (C, D) 1H‐15N HSQC spectra of 200 µm of NTD alone (black), and in complex with 400 µm of heat‐denatured α‐lactalbumin (C, green), and 450 µm of Sup35 NM prion protein (D, light red). The NTD residues that are broadened significantly upon interaction with each client are indicated. All three substrates bind to the same regions of the NTD.