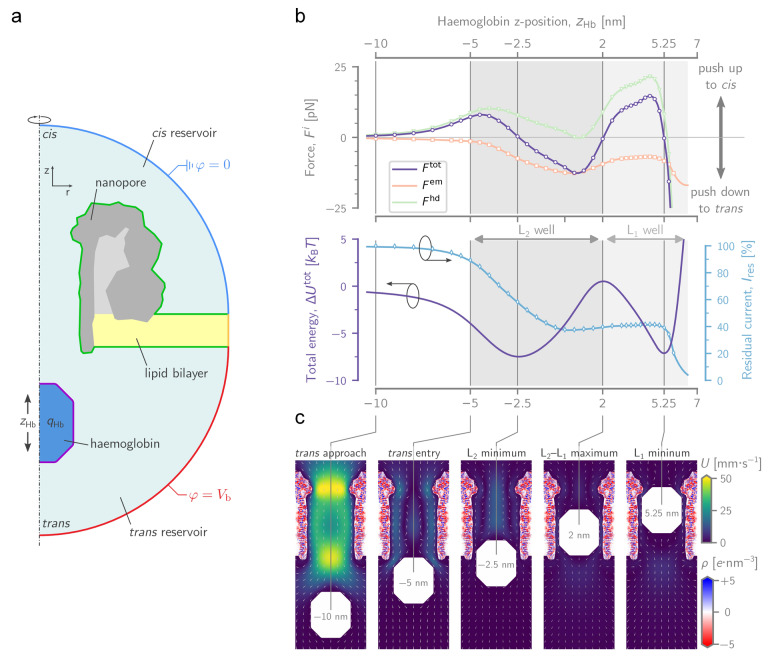
Figure 2.
A computational model of Hb trapping in PlyAB. a) Cartoon of the setup used in finite element modelling simulations, showing the geometry of the PlyAB pore (grey), the lipid bilayer (yellow), and the Hb particle (dark blue). b, top) Force landscape of Hb as it moves through PlyAB from trans to cis. The total force ( , purple) is the sum of the hydrodynamic ( , green) and the electromechanical ( , orange) force. Because both forces mostly oppose each other and are of equal magnitude, their fluctuations result in several locations where the total force on Hb is zero (a positive force means that Hb is pushed up, i.e., towards cis, and vice versa). b, bottom) On the energy landscape (purple), these points of zero force are translated into two local energy minima ( and ), separated by a local maximum ). The minima are presumed to correspond to the L2 and L1 current levels observed experimentally, respectively. The residual current landscape (blue) shows a rapid decline from 100 to 40 % as the Hb particle enters the lumen, after which it remains stable at until Hb reaches the cis constriction. c) Cross‐sectional heatmaps of the PlyAB‐Hb simulation at several key Hb locations ). The colouring shows the magnitude of the water velocity field ( ), whose direction is indicated by the arrows. The complex charge density of PlyAB ( ) is also drawn within the solid dielectric of the pore. Data in (c and Figure 2b) were for ( for HbA, for HbS, see Figure S8) and at .

