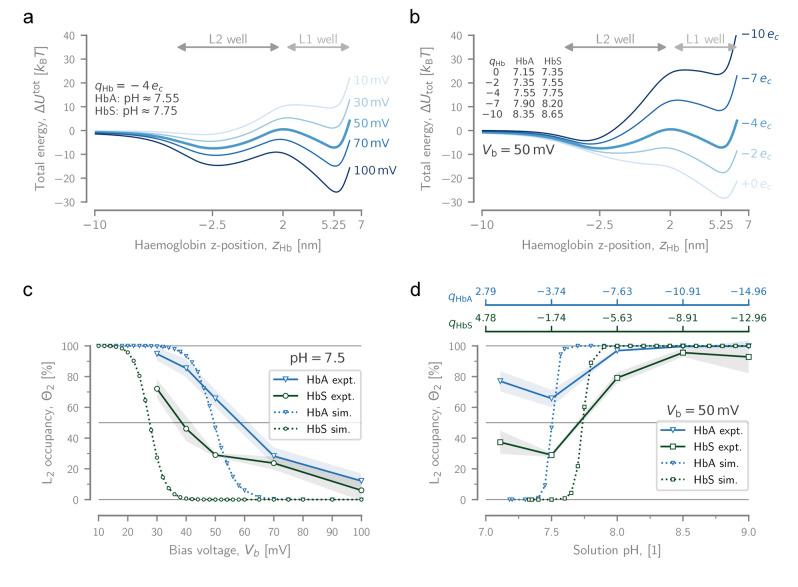
Figure 3.
Experimental and modelled dynamics of Hb. Dependence of the total potential energy for a Hb particle, , as it translocates through PlyAB from trans to cis on a) the applied bias voltage (at a fixed Hb charge: ), and b) the particle charge (at a fixed voltage: ). Note that corresponds to a solution pH‐values of and for HbA and HbS, respectively. The approximate pH values corresponding to the plotted charges listed on the graph, and a titration curve can be found in the Supporting Information (Figure S8). Dependence of the fractional occupation of L2 for HbA and HbS, as measured experimentally and estimated with simulation, on c) the applied bias voltage (at pH 7.5), and d) the solution pH (at ). At pH 7.5, the net charges of HbA and HbS are and , respectively. The shaded areas behind the experimental curves represent the standard deviation ( ). The simulation data only show conditions in which the L2 state is present as a distinct local minimum.

