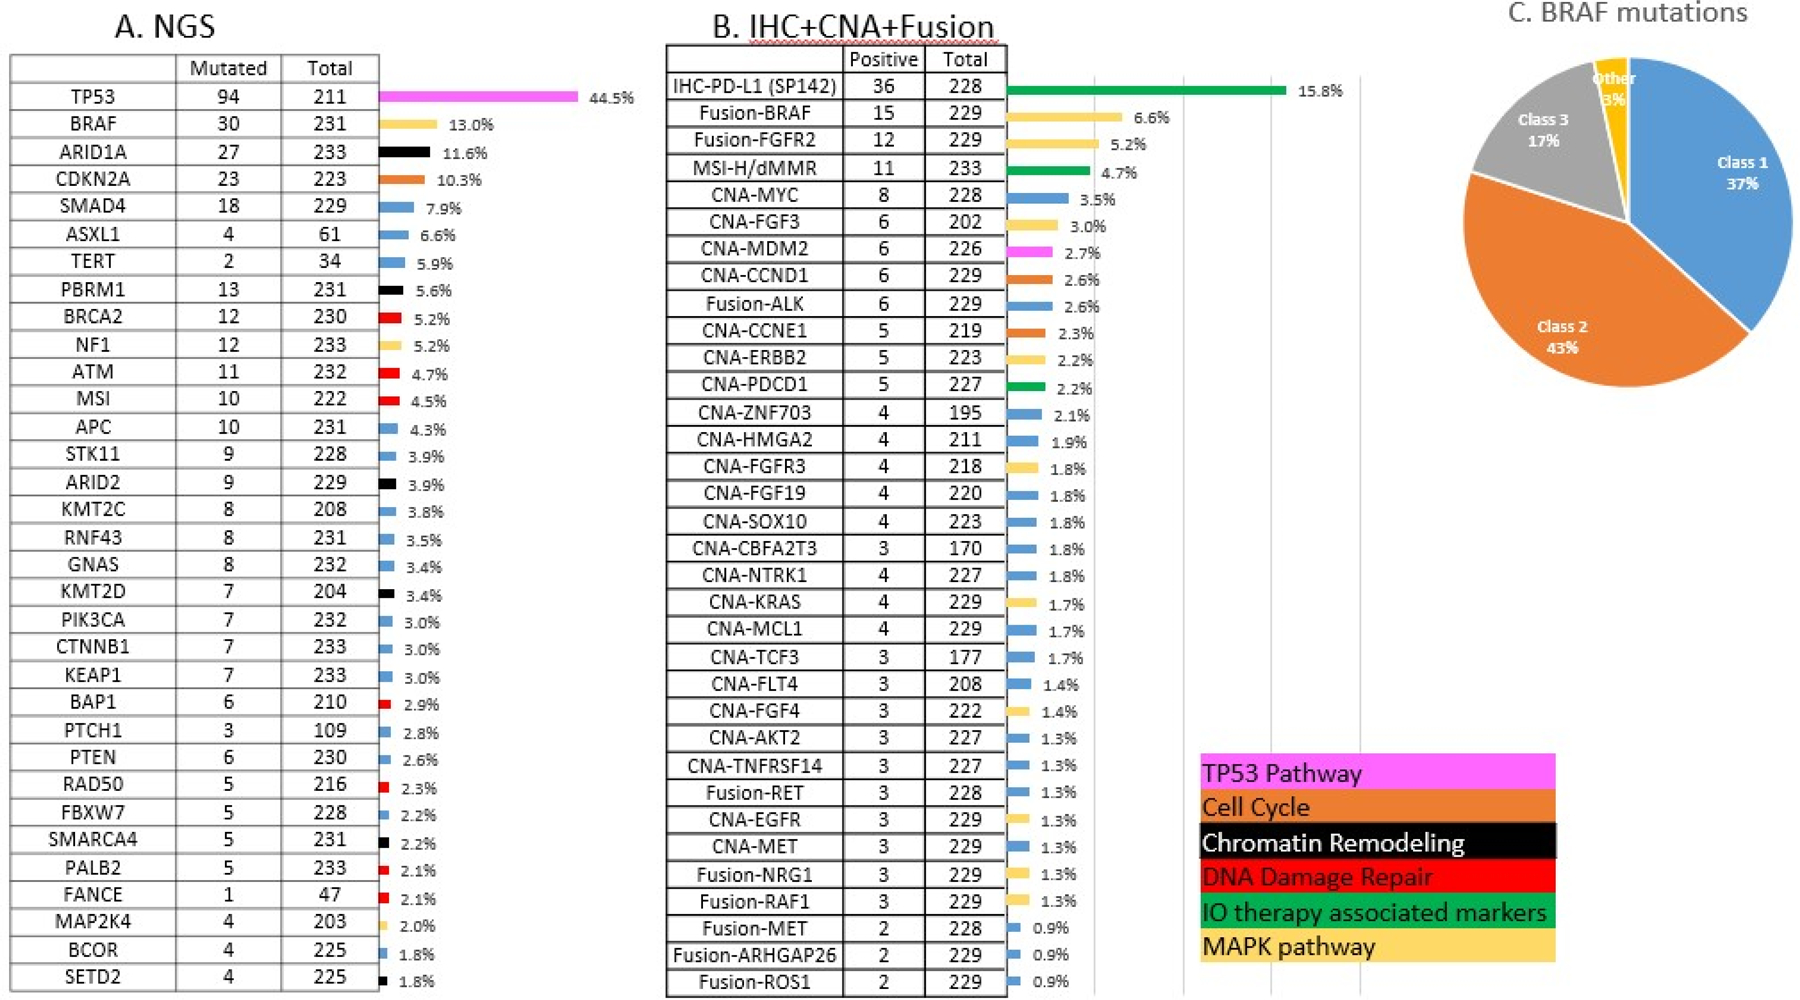
Figure 1:

Molecular alterations seen in KRAS-WT tumors. 1A: Mutation rates detected by NGS. 1B: Alteration rates detected by immunohistochemistry, copy number amplification rates detected by NGS and fusion rates detected by RNA sequencing. Bars are color coded according to the oncogenic pathways of each biomarker. 1C: BRAF mutations seen in the cohort categorized into class 1, 2 and 3 based on mechanism of action.
