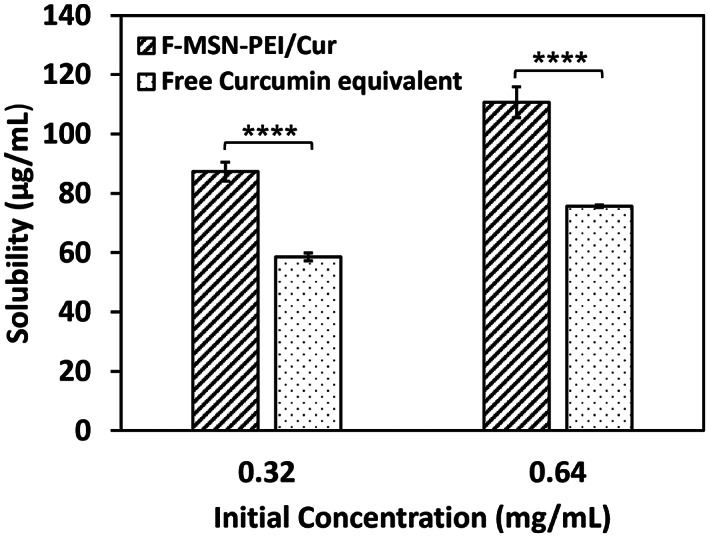
FIGURE 2.

Solubility of curcumin in the F‐MSN‐PEI/Cur design in comparison to free equivalent curcumin content at different concentrations. The results are expressed as mean ± SD (n ≥ 3). Statistical analysis was performed between F‐MSN‐PEI/Cur and equivalent curcumin at each concentration by applying two‐way ANOVA followed by Sidak's multiple comparison test. *p < .03, **p < .002, ***p < .0002, ****p < .0001
