FIGURE 4.

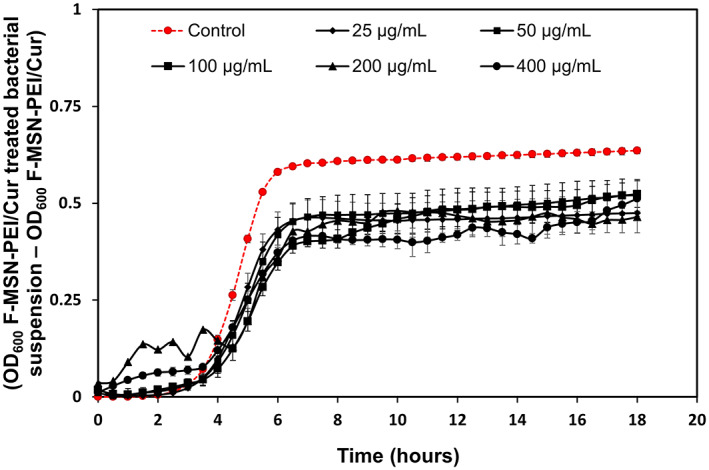
Growth profile of S. aureus cells upon exposure to ascending concentrations of F‐MSN‐PEI/Cur suspensions during 18 h to investigate the changes in growth profile in the presence of F‐MSN‐PEI/Cur. Error bars represent SD (n ≥ 3).

Growth profile of S. aureus cells upon exposure to ascending concentrations of F‐MSN‐PEI/Cur suspensions during 18 h to investigate the changes in growth profile in the presence of F‐MSN‐PEI/Cur. Error bars represent SD (n ≥ 3).