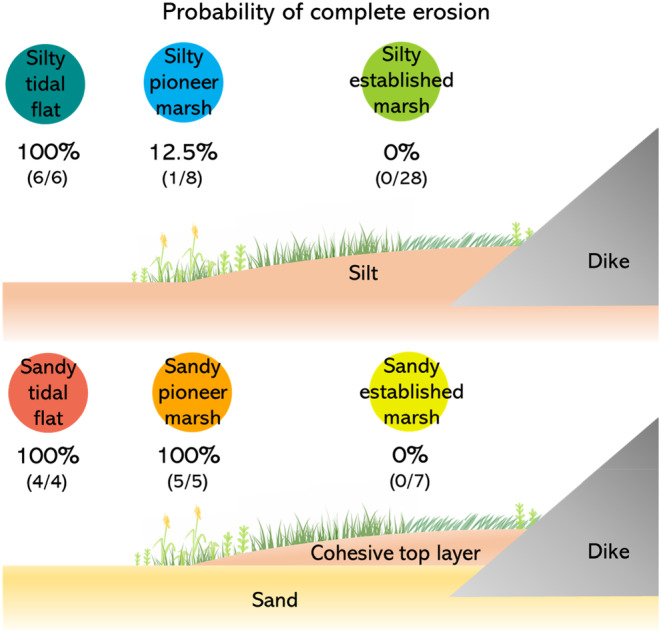
FIGURE 4.

Graphic representation of the habitat types and the probability of complete erosion in samples from each of these habitats. Numbers in brackets indicate the number of samples completely eroded by the total number of samples for each habitat type.
