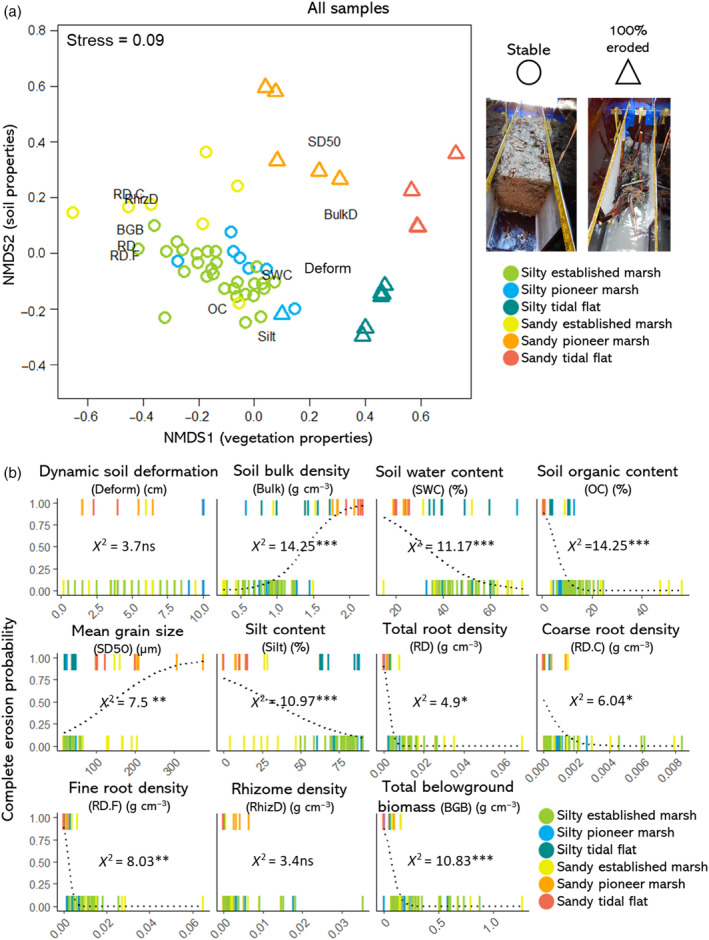
FIGURE 5.

(a) Nonmetric multidimensional scaling ordination depicting the environmental variables, habitat types, and erosion, including samples that completely eroded and stable samples. Erosion is expressed as binary in the shapes of the points. Stress value = 0.09. (b) Simple logistic regressions between the environmental variables and binary erosion (stable = 0 vs. completely eroded = 1) including all the samples. Points are represented as lines for better visualization due to points overlapping. Significance codes refer to p < 0.001 (***); p < 0.001 (**); p < 0.01 (*); p > 0.05 (ns).
