. 2022 Oct 6;19:E63. doi: 10.5888/pcd19.220081

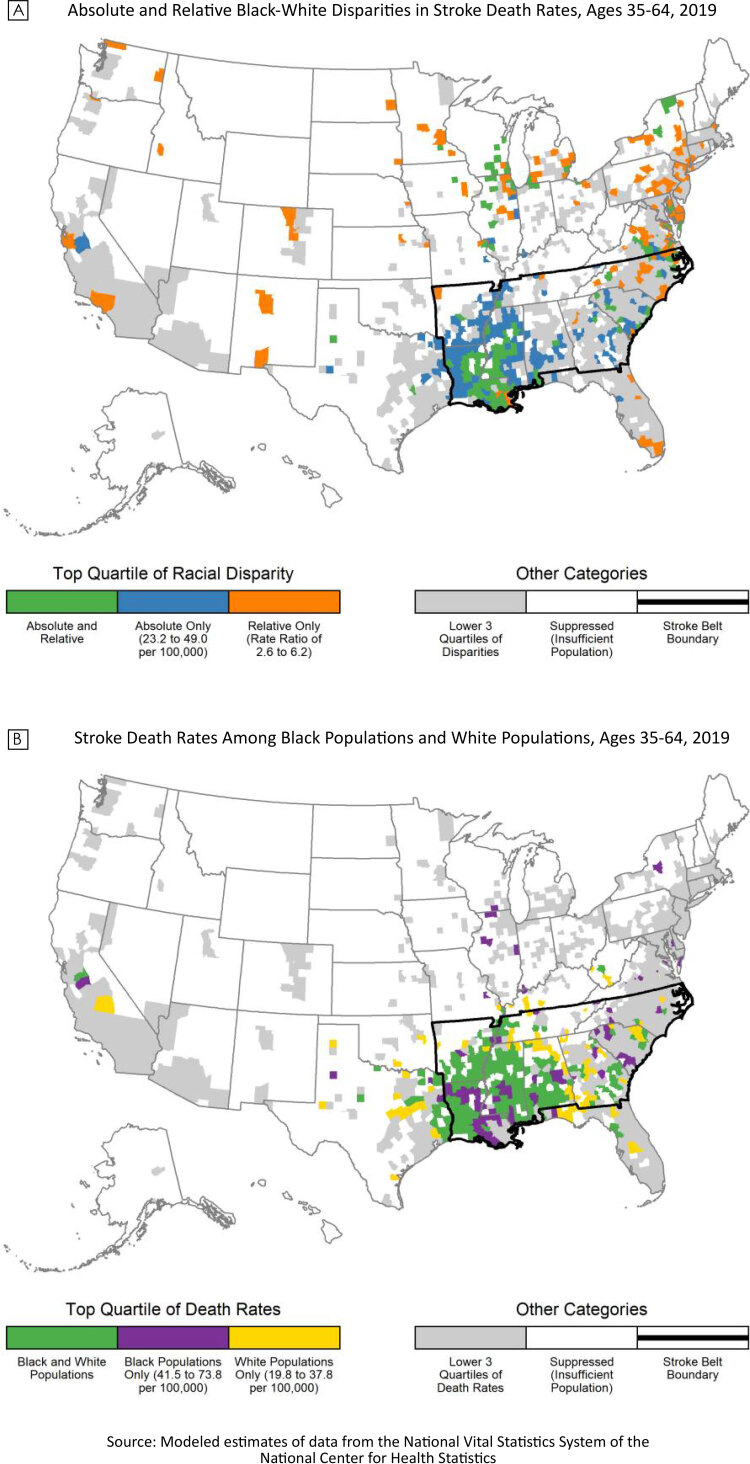
Map A shows that the highest absolute and relative Black–White disparities in stroke mortality among US adults aged 35–64 years have markedly different geographic patterns. Counties in the top quartile (top 25%) of absolute racial disparities are located primarily within the Stroke Belt, where stroke death rates are highest for both Black populations and White populations (Map B). Counties in the top quartile of relative racial disparities are often located outside the Stroke Belt. Efforts to eliminate Black–White disparities in stroke mortality would benefit from taking both absolute and relative measures of disparity into consideration.

Absolute and relative Black–White disparities in stroke death rates for people aged 35 to 64 years, 2019 (Map A), and stroke death rates for Black populations and White populations for people aged 35 to 64 years, 2019 (Map B). Source: National Center for Health Statistics.