
FIGURE 3.
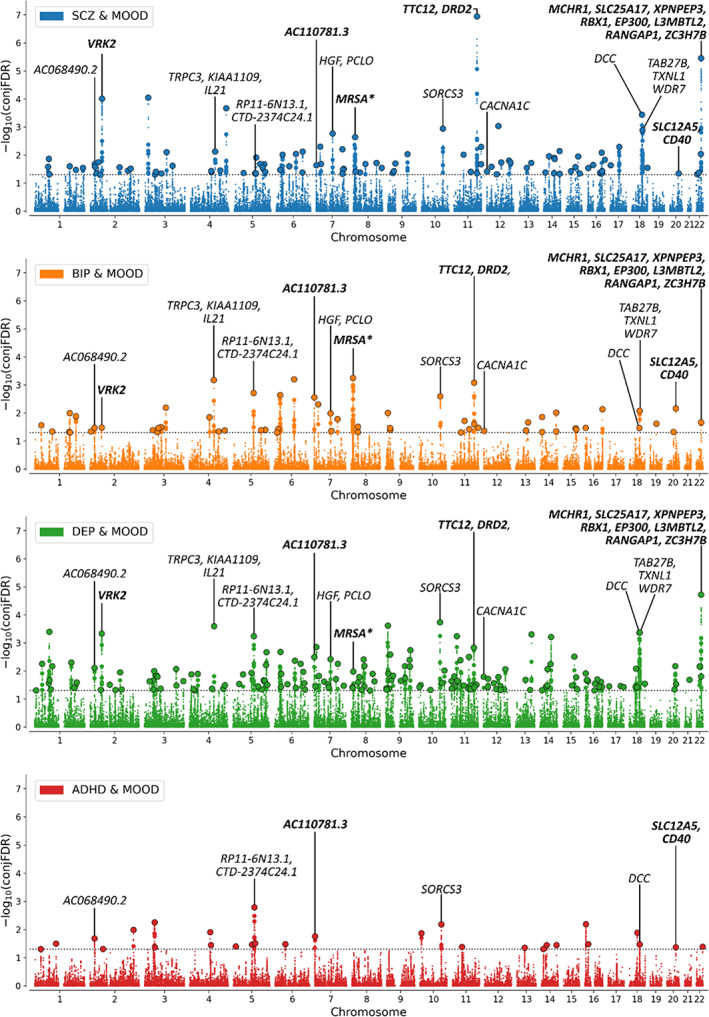
Manhattan plot showing ‐log10 transformed conjunctional FDR (conjFDR) values (y axis) for mood instability (MOOD) and (a) schizophrenia (SCZ, blue), (b) bipolar disorder (BIP, orange), (c) major depression (DEP, green), and (d) attention‐deficit hyperactivity disorder (ADHD, red) against chromosomal position (x axis) for each SNP. The dotted line represents conjFDR <0.05 significance threshold. Black circles represent lead SNPs. Lead SNPs from transdiagnostic loci across three or more disorders are annotated with mapped genes. N.B. Not all mapped genes for each locus are presented due to space limitations. Credible genes (bold) were prioritized followed by protein‐coding genes and then nonprotein‐coding genes. *Locus spans 8p23 inversion region with complex linkage disequilibrium. This biases gene‐mapping strategies so only a single mapped gene is presented.