
FIGURE 1.
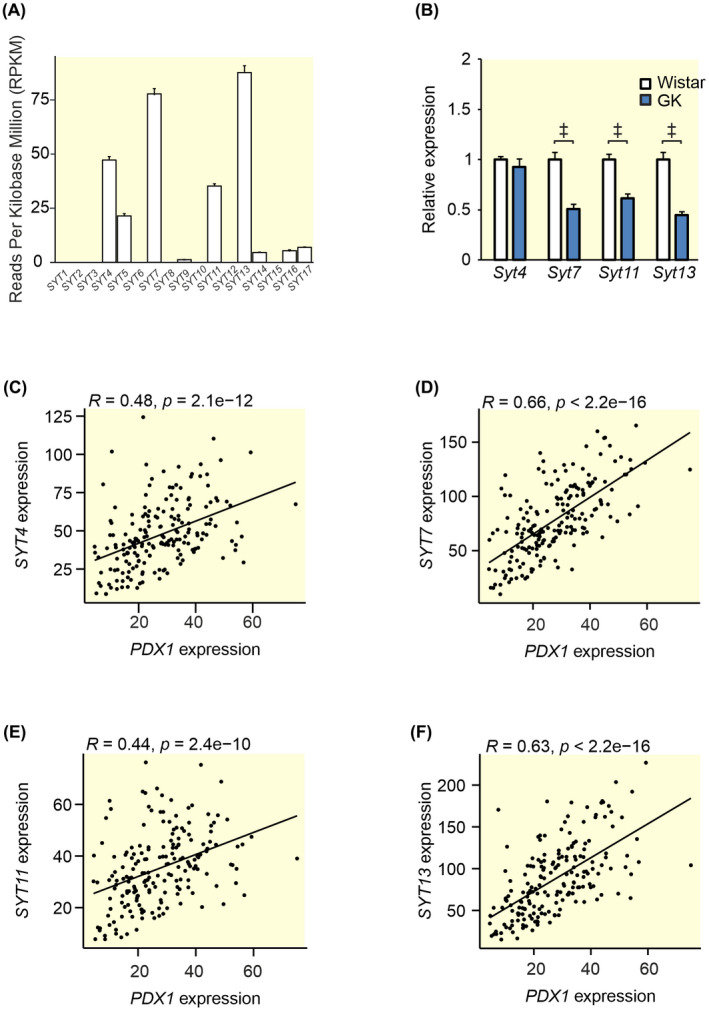
Gene expression of SYTs in human and GK islets and Spearman correlations between the most highly expressed SYTs and PDX1 in human islets. (A) Processed previously described RNA sequencing data 15 obtained from publicly available repositories (GSE50398, GSE108072) showing SYT expression in islets from 188 human donors. Expression is shown as Reads Per Kilobase Million (RPKM). (B) qPCR data from GK rat islets (blue bars) and Wistar control islets (white bars) showing the relative expression of the four most highly expressed SYTs in (A). Spearman correlations between PDX1 and (C) SYT4, (D) SYT7, (E) SYT11, and (F) SYT13 using the data in (A) in RPKM. Data are presented as mean ± SEM of 188 donors in (A) and 7–8 rats in (B). *p ≤ 0.05, † p ≤ 0.01, ‡ p < 0.001.