
FIGURE 4.
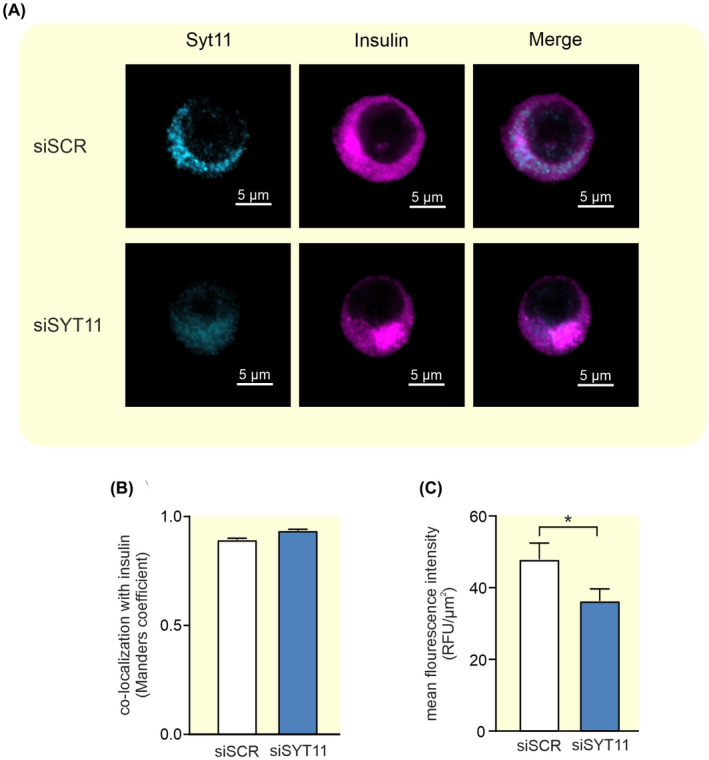
Colocalization between Syt11 and insulin in INS‐1 832/13 cells. (A) Representative confocal images of Syt11 (light blue) and insulin (violet) in INS‐1 832/13 control cells (siSCR) and cells treated with siRNA against Syt11 (siSYT11). (B) Colocalization of Syt11 and insulin quantified with Manders coefficient in siSCR (white bar) and siSYT11 (blue bar) cells. (C) Quantification of the mean fluorescence intensity of Syt11 in siSCR (white bar) and siSYT11 (blue bar) cells. Data are given as mean ± SEM from 21 to 24 cells. *p ≤ 0.05.