
FIGURE 7.
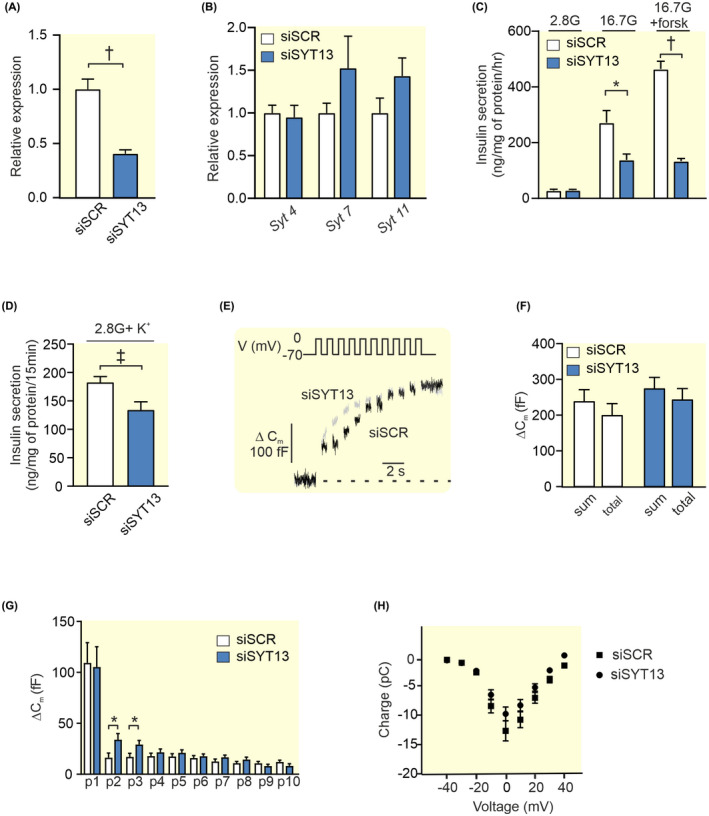
Knockdown of Syt13 and its effect on insulin secretion and exocytosis in INS‐1 832/13 cells. (A) Expression of Syt13 after silencing with siRNA (siSYT13; blue bar) relative to its expression using scramble control (siSCR; white bar). (B) Relative expression of Syt4, Syt7, and Syt11 in siSYT13 (blue bars) and siSCR (white bars) cells (C) Insulin secretion in siSYT13 (blue bars) and siSCR (white bars) cells after stimulation for 1 h in 2.8 mM glucose (2.8G), 16.7 mM glucose (16.7G), or 16.7 mM glucose + 2.5 μM forskolin (16.7G + forsk) as indicated. (D) Insulin secretion in siSYT11 (blue bars) and siSCR (white bars) cells after stimulation with 50 mM K+ in 2.8 mM glucose for 15 min. (E) Representative traces of depolarization‐induced increases in membrane capacitance in siSYT13 (black trace) and siSCR (gray trace) cells. (F) Summed capacitance changes (sum) and the total capacitance change (total) for siSYT13 (blue bar) and siSCR (white bar) after a train of ten 500 ms long depolarisations. (G) The capacitance change for siSYT13 (blue bar) and siSCR (white bar) after each individual pulse in (F). (H) Charge—voltage relationships siSYT13 cells (black circles) compared to scramble controls (black squares). Data are given as mean ± SEM from three to five experiments in (A–D) and 28–29 cells in (E–H). *p ≤ 0.05, † p ≤ 0.01, ‡ p < 0.001.