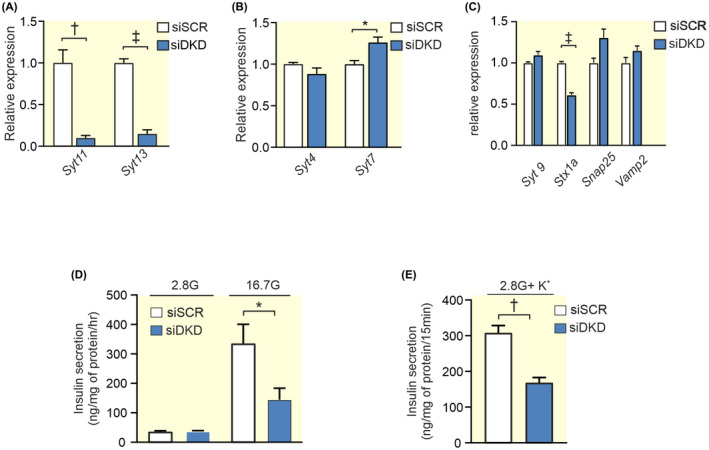
FIGURE 9.

Double knockdown of Syt11 and Syt13 and its effect on insulin secretion in INS‐1 832/13 cells. (A) Expression of Syt11 and Syt13 (blue bar) after double silencing with siRNA (siDKD) relative to its expression using scramble control (siSCR; white bar). (B) Relative expression of Syt4 and Syt7 in siDKD (blue bars) and siSCR (white bars) cells. (C) Relative expression of selected exocytotic genes in siDKD (blue bars) compared to control (siSCR; white bars). (D) Insulin secretion in siDKD (blue bars) and siSCR (white bars) cells after stimulation for 1 h in 2.8 mM or 16.7 mM glucose as indicated. (E) Insulin secretion in siDKD (blue bars) and siSCR (white bars) cells after stimulation with 50 mM K+ in 2.8 mM glucose for 15 min. Data are given as mean ± SEM from four experiments. *p ≤ 0.05, † p ≤ 0.01, ‡ p < 0.001.
