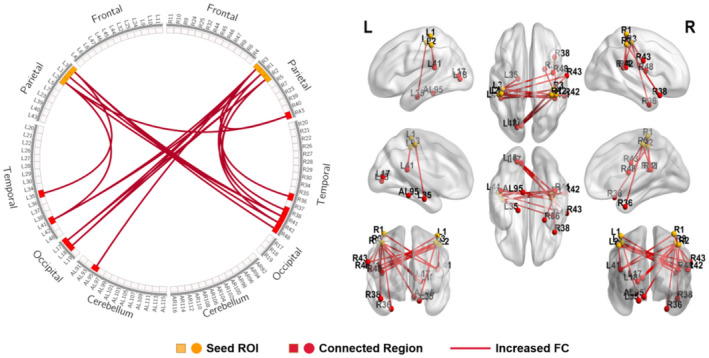
FIGURE 2.

Schematic diagram and anatomic replicas show increased FC between somatosensory cortices (BA1, BA2, BA3) and whole brain network in SCI patients compared with HCs. The yellow boxes and nodes represent the seed regions of FC. The red boxes and nodes represent the connected regions of FC. The red line denotes the increased FC in SCI patients compared with HCs. L, left; R, right.
