
FIGURE 1.
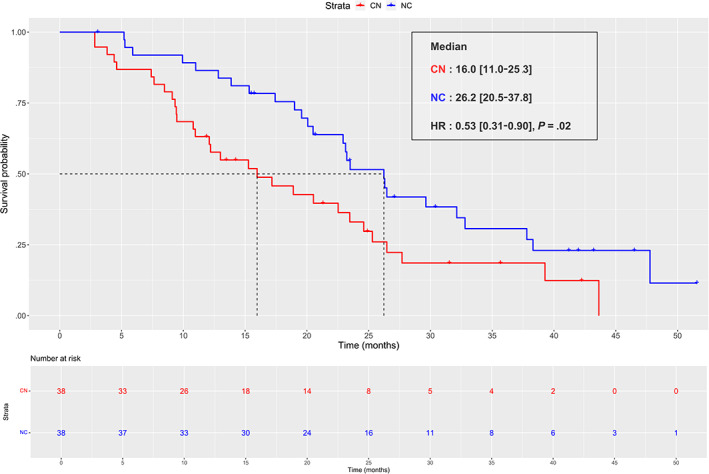
Progression‐free survival from L2 to L3 (PFS2‐3) in matched (1:1) population. Kaplan‐Meier curve of progression‐free‐survival from second line to third line in matched (1:1) population (n = 38). The red curve represents the cabozantinib‐nivolumab (CN) sequence and the blue curve represents the nivolumab‐cabozantinib (NC) sequence [Color figure can be viewed at wileyonlinelibrary.com]