
FIGURE 3.
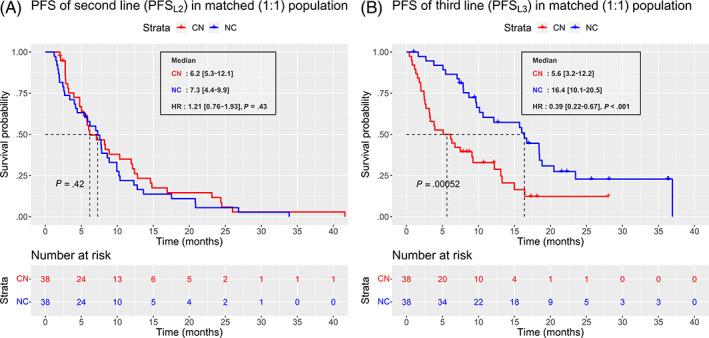
Progression‐free survival (PFS) in second and third lines. Kaplan‐Meier curves of progression‐free‐survival (PFS) in second (A) and third line (B). The red curve represents the cabozantinib‐nivolumab (CN) sequence and the blue curve represents the nivolumab‐cabozantinib (NC) sequence [Color figure can be viewed at wileyonlinelibrary.com]