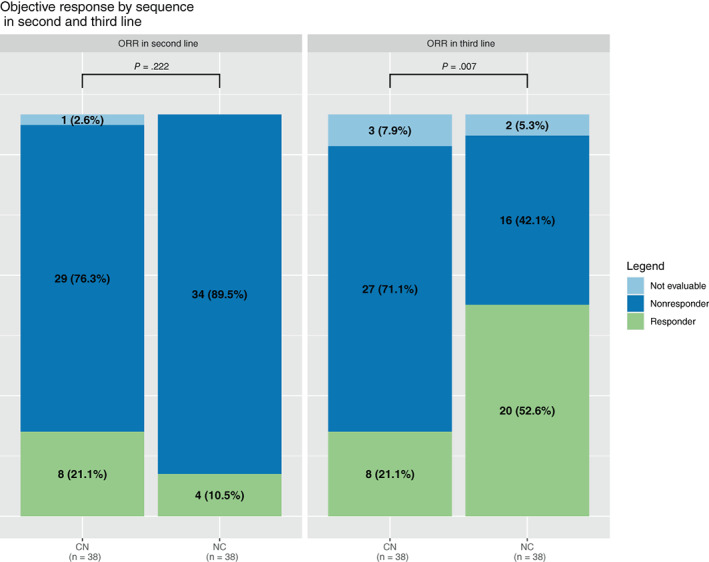
FIGURE 4.

Objective response rate (ORR) during second and third lines. Histogram representing the objective response rate (RECIST 1.1) with cabozantinib and nivolumab in second (left) and third line (right) in matched (1:1) population (n = 38). Green bars represent responders (complete and partial), dark blue bars represent nonresponders (progression and stable disease) and light blue bars represent nonevaluable patients. CN, cabozantinib‐nivolumab; NC, nivolumab‐cabozantinib [Color figure can be viewed at wileyonlinelibrary.com]
