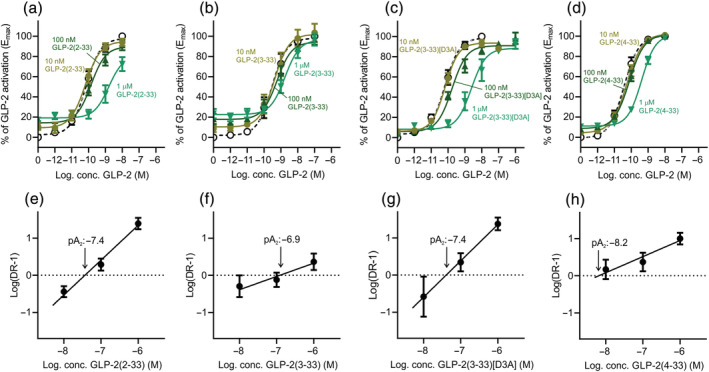
FIGURE 4.

Schild plots of GLP‐2(2‐33), GLP‐2(3‐33), GLP‐2(3‐33)[D3A] and GLP‐2(4‐33) on the human GLP‐2R. COS‐7 cells were transiently transfected with the human GLP‐2R and assessed for cAMP accumulation upon ligand stimulation with GLP‐2 in the absence or presence of increasing concentrations (a) GLP‐2(2‐33), (b) GLP‐2(3‐33), (c) GLP‐2(3‐33)[D3A] and (d) GLP‐2(4‐33). The corresponding Schild plots of (e) GLP‐2(2‐33), (f) GLP‐2(3‐33), (g) GLP‐2(3‐33)[D3A] and (h) GLP‐2(4‐33) indicating their respective pA2 value. Data are shown as mean ± SEM, from n = 5 independent experiments carried out in duplicate.
