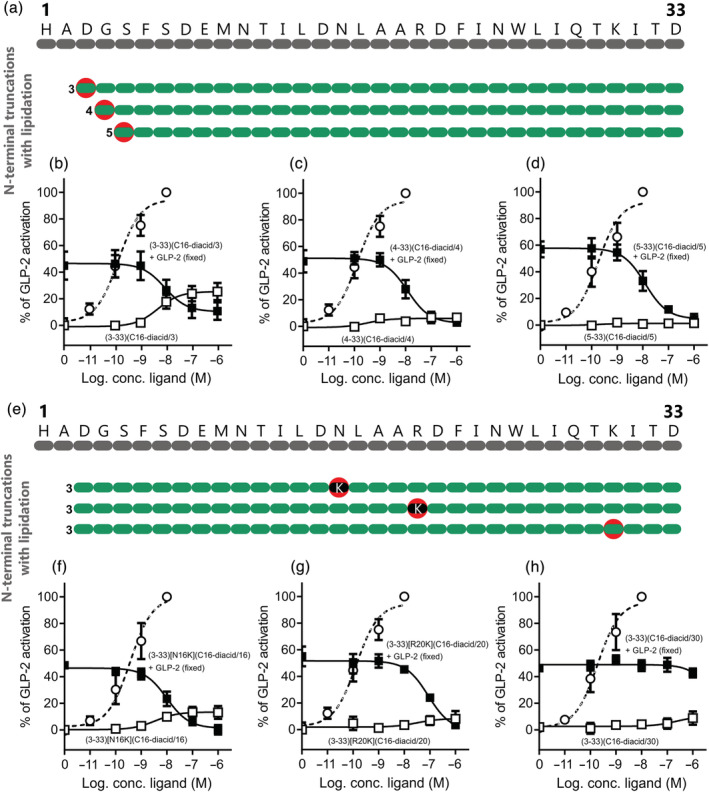
FIGURE 6.

cAMP activation and inhibition profiles of N‐terminally truncated and lipidated GLP‐2 variants on the human GLP‐2R. (a) Schematic overview of the N‐terminally truncated lipidated GLP‐2 variants. The red circles indicate where a 16‐carbon fatty diacid chain has been attached. COS‐7 cells were transiently transfected with human GLP‐2R and assessed for either cAMP activation or inhibition with (b) GLP‐2(3‐33)(C16‐diacid/3), (c) GLP‐2(4‐33)(C16‐diacid/4) or (d) GLP‐2(5‐33)(C16‐diacid/5). (e) Schematic overview of the N‐terminally truncated amino acid modified lipidated GLP‐2 variants. The red circles indicate where a 16‐carbon fatty diacid chain has been attached, and the black dots indicate where an amino acid has been substituted. COS‐7 cells were transiently transfected with the human GLP‐2R and assessed for either cAMP activation or inhibition with (f) GLP‐2(3‐33)[N16K](C16‐diacid/16), (g) GLP‐2(3‐33)[R20K](C16‐diacid/20) or (h) GLP‐2(3‐33)(C16‐diacid/30). The dashed line represents human GLP‐2. Data are shown as mean ± SEM, from n = 3 independent experiments carried out in duplicate.
