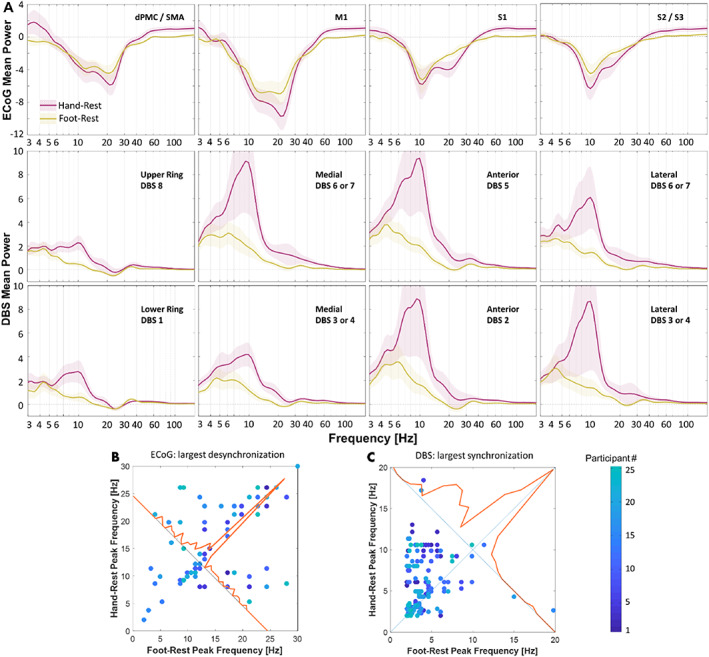
FIG 3.

Cortical and subcortical spectral perturbations in participants with Parkinson's disease (PD) during continuous, repetitive hand and foot movements minus rest. (A) Spectral power for all participants (n = 25) and recording sites are summarized in row 1 for sensorimotor cortex and rows 2 and 3 for dorsal and ventral deep brain stimulation (DBS) contacts (mean across participants ± standard error). Red and yellow traces correspond to hand and foot signals, respectively. (B, C) Frequencies that displayed the strongest deviations during movement versus rest in cortex and subthalamic nucleus (STN; ie, either desynchronization or synchronization). If the spectral perturbations are identical, observations will appear on or near the unity line (diagonal line). (B) Frequencies corresponding to power minima in dorsal premotor cortex/supplementary motor area, primary motor cortex (M1), primary somatosensory cortex (S1), and S2/S3 contacts during foot versus hand movements. (C) Frequencies corresponding to power maxima from all DBS contacts during foot versus hand movements. ECoG, electrocorticography.
