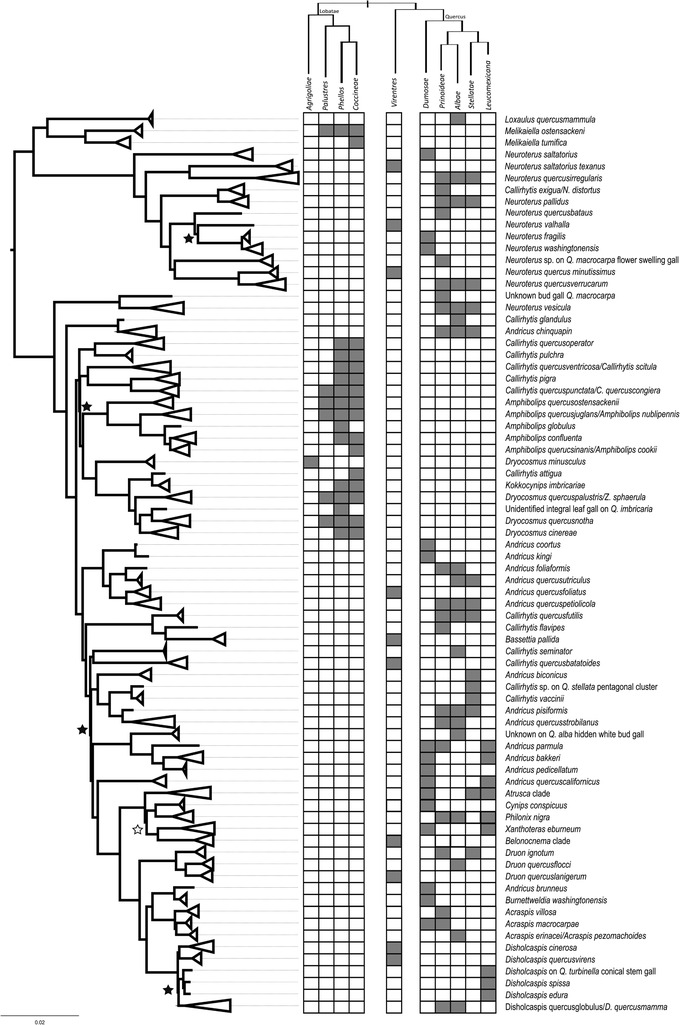
Figure 2.

Phylogenetic representation of Nearctic gall wasps based on partitioned 75% completeness data matrix (see Fig. S8 for the expanded tree). Clades have been collapsed to the species or genus level as in Figure 1. Gray boxes in the table to the right of the tree represent known host associations—including those from which we collected insects and those from the literature—for each gall wasp species at the level of oak subsection. The cladogram above the table represents the evolutionary relationships among subsections within sections Lobatae, Virentes, and Quercus (section Virentes has no subsections). All nodes have 100% bootstrap support, except for those indicated with black (<100%) or white (<80%) stars. Although this tree implies that many oak gall wasp species induce galls on trees across >1 subsection, it may instead be the case that many taxa are species complexes, each species having a more restricted host range (see Discussion).
