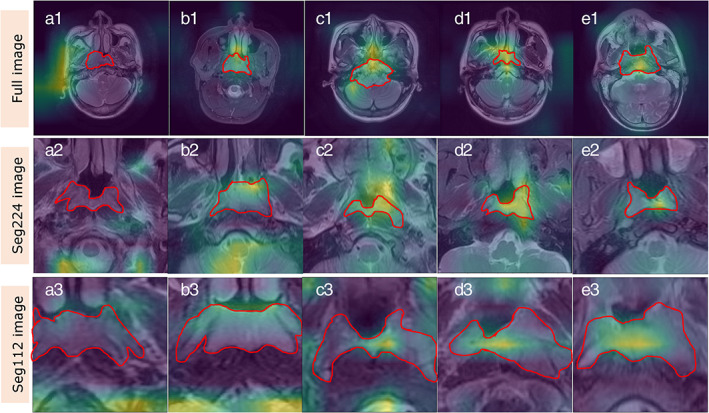
FIGURE 3.

Evaluation rules of interpretability of deep learning (DL) model. The red area represents the area where the lesion is located, and the yellow‐green bright area is the extracted feature maps which indicates the classification basis of the model. The Grad‐CAM diagrams of A1, A2, and A3 show that the features extracted by the model are almost not in the lesion area, which is rated as 0; B1, B2, and B3 show that only a small part of the features extracted by the model are in the lesion area, which is rated as 0.25 points; C1, C2, and C3 show that about half of the features extracted by the model are in the lesion area, which is rated as 0.5 points; D1, D2, and D3 show that most of the features extracted by the model are in the lesion area, which is rated as 0.75; E1, E2, and E3 show that almost all the features extracted by the model are in the lesion area, which is rated as 1 point.
