FIGURE 6.

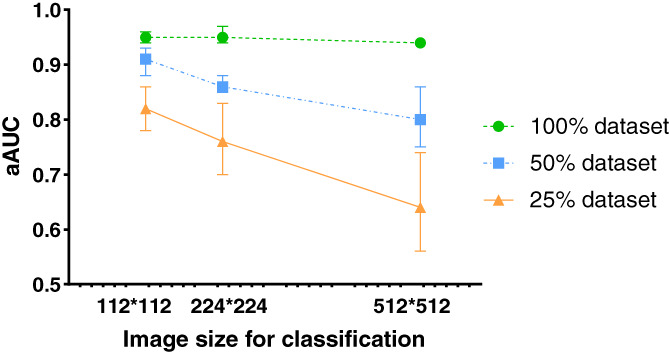
Average areas under the curve (aAUCs) of the models trained with different image sizes (112 × 112, 224 × 224, and 512 × 512) using 100%, 50%, and 25% datasets in the test cohort.

Average areas under the curve (aAUCs) of the models trained with different image sizes (112 × 112, 224 × 224, and 512 × 512) using 100%, 50%, and 25% datasets in the test cohort.