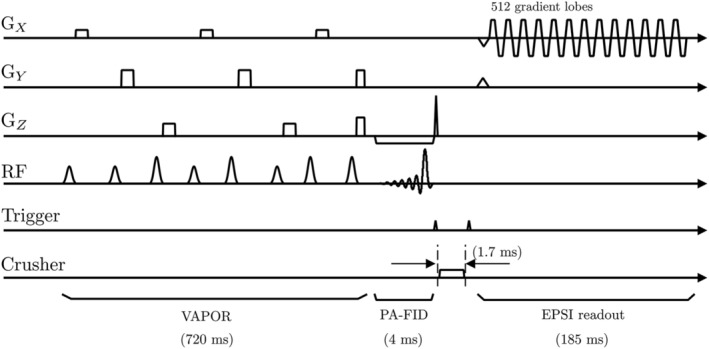
FIGURE 1.

Pulse sequence diagram used for the free induction decay–echo‐planar spectroscopic imaging (FID‐EPSI) acquisition. The sequence consists of variable power and optimized relaxation delays (VAPOR) water suppression and the trigger signal generated by spectrometer initialization of an external amplifier that drives the crusher coil, followed by the FID‐EPSI readout at 7 T. The duration of the lipid suppression gradient is 1.7 ms. The FID‐EPSI sampled 512 spectral points with a 2379 Hz spectral bandwidth and a 185 ms readout time
