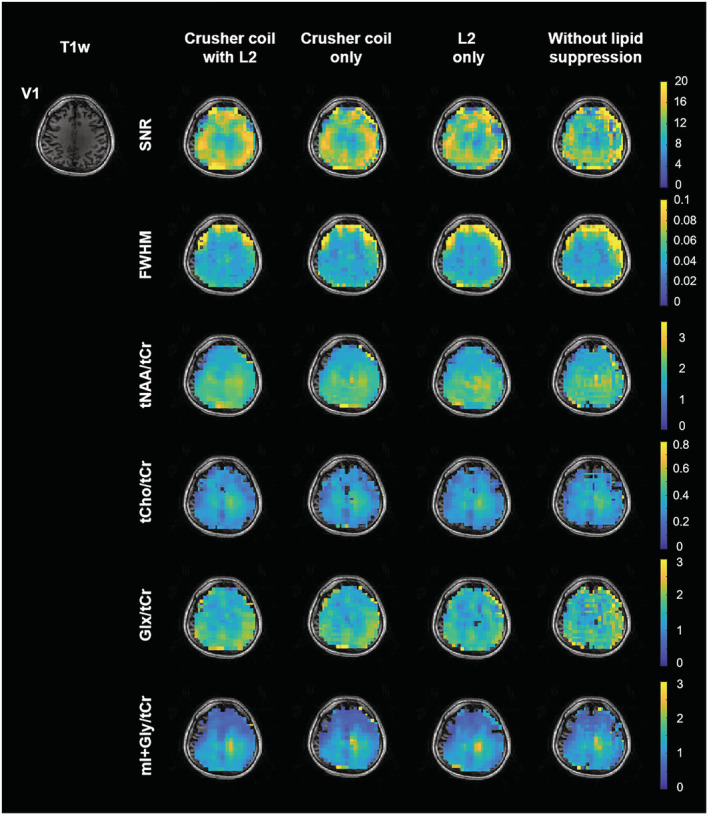
FIGURE 5.

Quality assurance maps (signal‐to‐noise ratio [SNR] and full width at half maximum [FWHM]) and the reconstructed metabolite ratio (divided by creatine + phosphocreatine [tCr]) maps of N‐acetyl‐aspartate + N‐acetyl aspartate glutamate (tNAA), choline + glycerophosphorylcholine + phosphorylcholine (tCho), glutamine + glutamate (Glx), and myo‐inositol + glycine (mI + Gly) were generated using different lipid‐suppression strategies. In the unsuppressed lipid case, clear effects of the lipid point‐spread function were evident for tNAA, Glx, and mI + Gly. Optimal lipid suppression was achieved with the combination of the crusher coil (direct lipid suppression) and L2‐regularization (lipid removal). For visualization, T1‐weighted image and metabolite ratio maps were interpolated by a factor of 2 (the final matrix size is 76 × 76)
