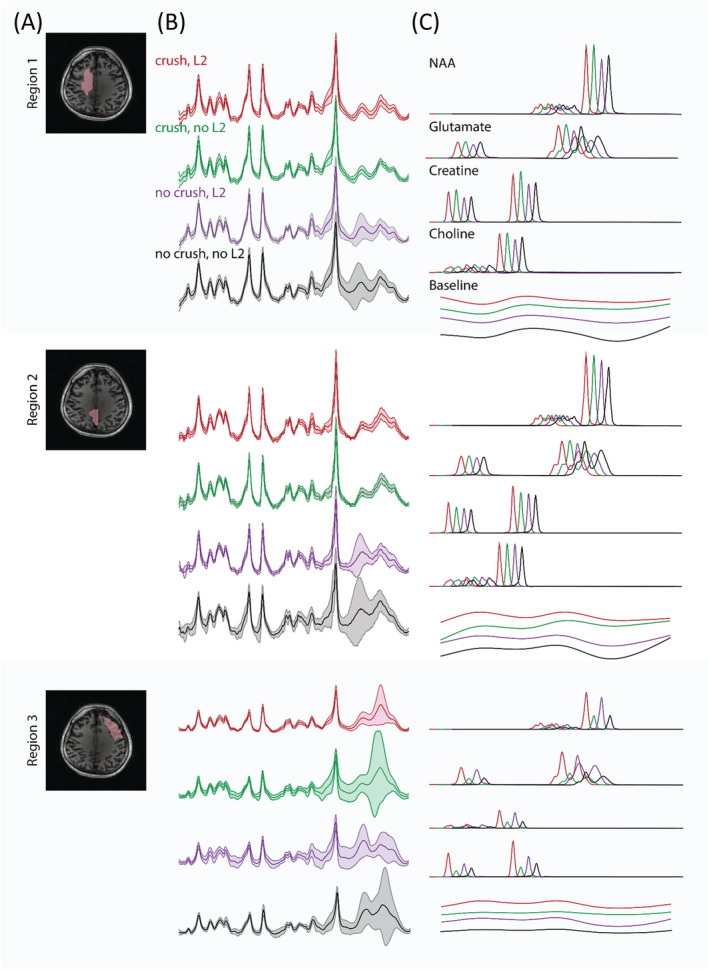
FIGURE 6.

(A) T1‐weighted image with the delineation of three regions of interest (ROIs) at V1. Region 1 contains predominantly white matter, and region 2 contains predominantly gray matter + CSF, while region 3 highlights boundary effects related to the lipid suppression field of the crusher coil. (B) Voxel average (solid line) and standard deviation (shaded area) of the fitted MR spectra for each ROI and each experimental variant; (red) crusher coil and L2‐regularization, (green) crusher coil and no L2‐regularization, (purple) no crusher coil and L2‐regularization, and (black) no crusher coil and no L2‐regularization. (C) Individual fits of tNAA, Glx, tCr, tCho, and the baseline in the four experimental settings (red, green, purple, and black). Note that spectra have been shifted to facilitate visual comparison
