
Figure 3.
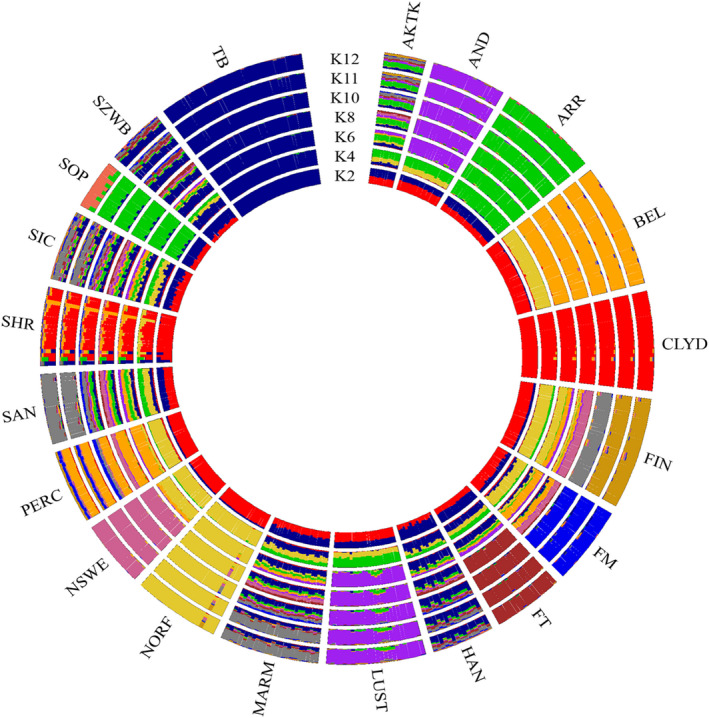
Circle plot showing ancestral clusters (K) inferred by ADMIXTURE analysis of the 20 horse populations. For a full definition of the populations, see Table 1 [Colour figure can be viewed at wileyonlinelibrary.com]
Official websites use .gov
A
.gov website belongs to an official
government organization in the United States.
Secure .gov websites use HTTPS
A lock (
) or https:// means you've safely
connected to the .gov website. Share sensitive
information only on official, secure websites.
Circle plot showing ancestral clusters (K) inferred by ADMIXTURE analysis of the 20 horse populations. For a full definition of the populations, see Table 1 [Colour figure can be viewed at wileyonlinelibrary.com]