
FIGURE 1.
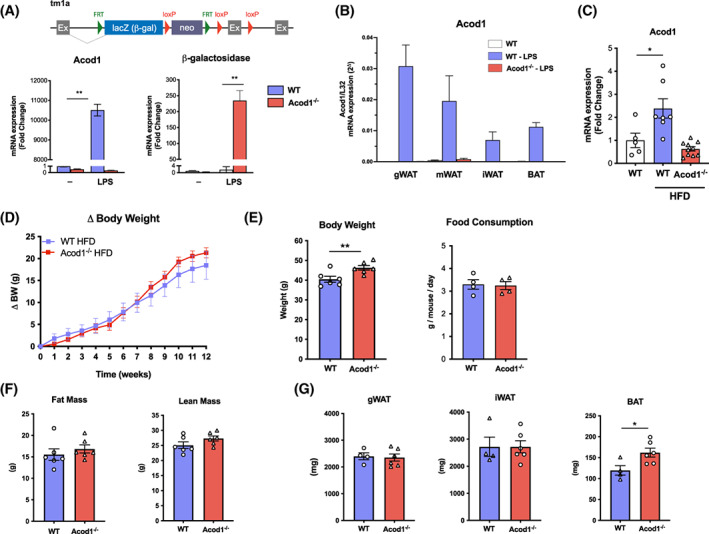
Acod1 is increased in adipose tissue during inflammation and obesity. (A) tm1a construct from KOMP used to generate Acod1−/− mice. Bone marrow‐derived macrophages from Acod1−/− mice treated with LPS show efficient knockout. (B) Effect of LPS and (C) high‐fat diet (HFD) on Acod1 expression by qPCR in adipose tissue. (D) Acod1−/− mice on HFD gain the same amount of weight as wild‐type (WT) controls. (E) Body weight (BW) after 12 weeks on HFD and food consumption. (F) Total fat mass and lean mass measured by MRI at 12 weeks on HFD. (G) Fat depot mass at 12 weeks on HFD. N = 4–10. *p < 0.05, **p < 0.01 [Color figure can be viewed at wileyonlinelibrary.com]