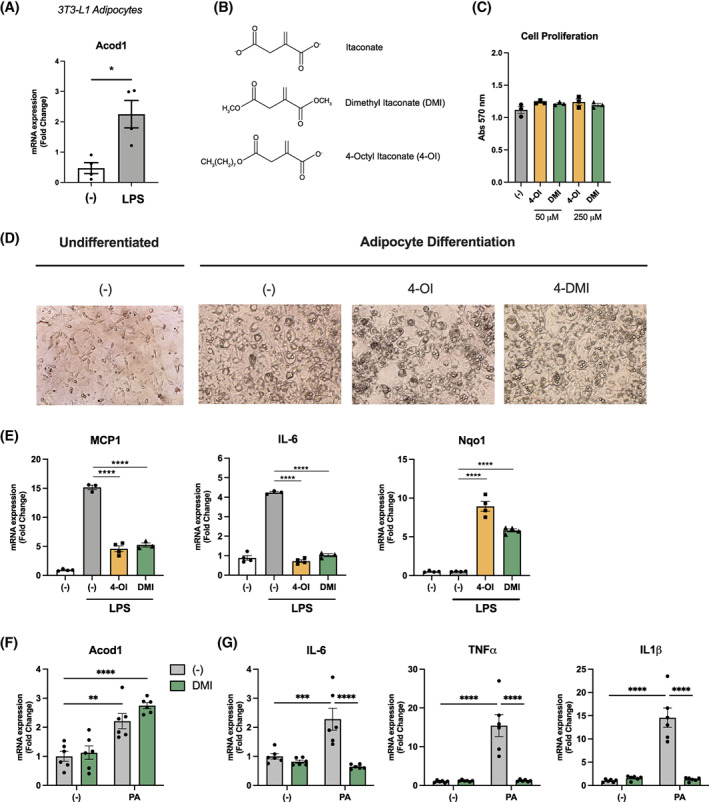
FIGURE 4.

3T3‐L1 adipocytes express Acod1 and have attenuated inflammatory signaling with itaconate treatment. (A) Acod1 expression in LPS‐treated 3T3‐L1 adipocytes. (B) Structure of itaconate and cell‐permeable derivatives. (C) Cell proliferation of 3T3‐L1 adipocytes measured by MTT assay after adipocyte differentiation. (D) Photomicrograph of 3T3‐L1 cells before and after differentiation. (E) mRNA gene expression of MCP1, IL‐6, and Nqo1 from 3T3‐L1 adipocytes treated with LPS in the presence and absence of itaconate derivatives. (F) Acod1 expression in 3T3‐L1 adipocytes after 24 hours of palmitic acid (PA) treatment. (G) mRNA gene expression of inflammatory genes in 3T3‐L1 adipocytes treated with PA after 12 hours of pretreatment with DMI. n = 3–6 per group. *p < 0.05, **p < 0.01, ***p < 0.001, ****p < 0.0001 [Color figure can be viewed at wileyonlinelibrary.com]
