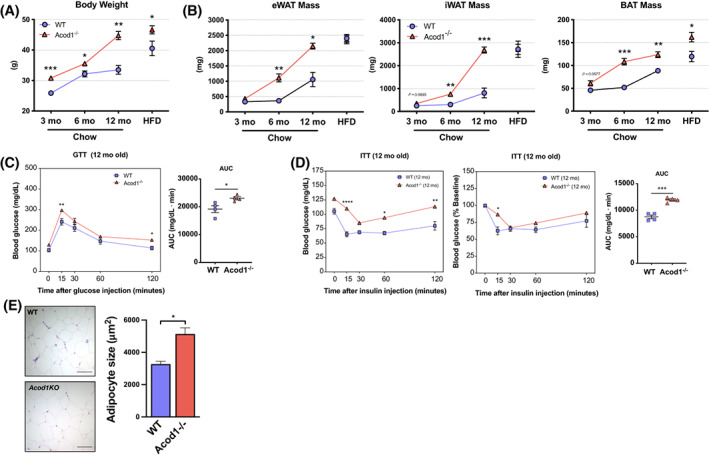
FIGURE 5.

Acod1−/− mice develop spontaneous obesity and impaired glucose metabolism with age. (A) Body weight time course in wild‐type (WT) and Acod1−/− mice. (B) Time course of eWAT, iWAT, and BAT fat pad mass. (C) Glucose tolerance tests (GTT) and (D) insulin tolerance tests (ITT) in naive 12‐month Acod1−/− mice and area under the curve (AUC) of nonnormalized ITT data. (E) Adipocyte size in 12‐month Acod1−/− mice. N = 4–7 per group. *p < 0.05, **p < 0.01, ***p < 0.001, ****p < 0.0001 [Color figure can be viewed at wileyonlinelibrary.com]
