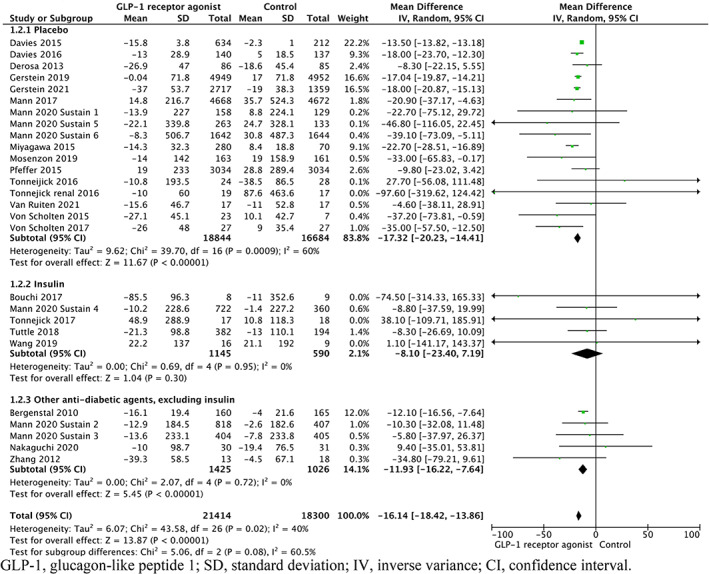
FIGURE 3.

Forest plot of the percentage change in albuminuria among patients randomized to different types controls compared with GLP‐1RAs. CI, confidence interval; GLP‐1, glucagon‐like peptide 1; IV, inverse variance; SD, standard deviation.

Forest plot of the percentage change in albuminuria among patients randomized to different types controls compared with GLP‐1RAs. CI, confidence interval; GLP‐1, glucagon‐like peptide 1; IV, inverse variance; SD, standard deviation.