
FIGURE 2.
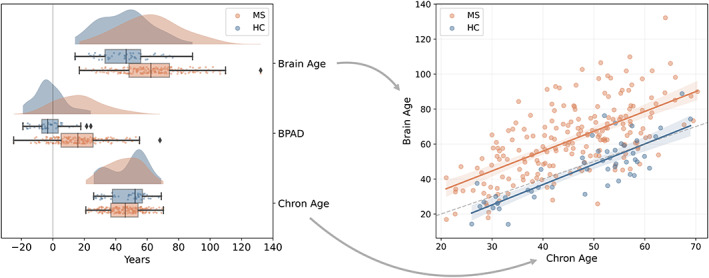
Group comparison between HC_test (blue) and MS_test (orange) for brain age, BPAD and chronological age. Left: The raincloud plots show the distribution of brain age, BPAD and chronological age for MS_test and HC_test. A reference line at x = 0 is included as visual aid. Right: The scatterplot shows the relationship between brain age and chronological age for MS_test and HC_test. The dotted line is added as reference, namely where brain age = chronological age [Color figure can be viewed at wileyonlinelibrary.com]