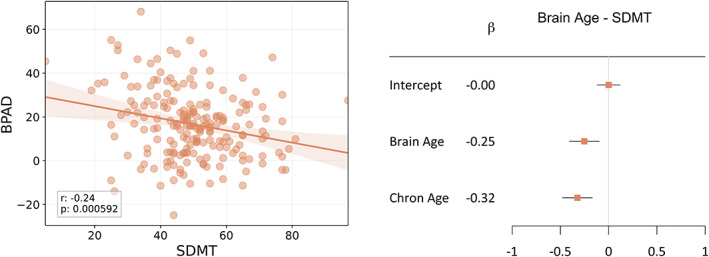
FIGURE 4.

The relationship between brain age and SDMT, independent of chronological age. Left: Scatterplot between BPAD and SDMT in the MS_test dataset. The textbox describes the Pearson r statistic, along with the p value. Right: Forest plot visualizing the significance of the weights (β n ) in the linear regression equation in the MS_test dataset (note that variables were normalized with respect to mean and standard deviation before input in the regression equation). The maximum likelihood estimates of the weights () are represented by the orange squares, along with a 95% confidence interval (horizontal bar). If the latter does not include 0, the contribution of that feature to the model is considered significant. Brain age and chronological age contributed significantly (p = 0.002 and p < 0.001 respectively) [Color figure can be viewed at wileyonlinelibrary.com]
