
Figure 9.
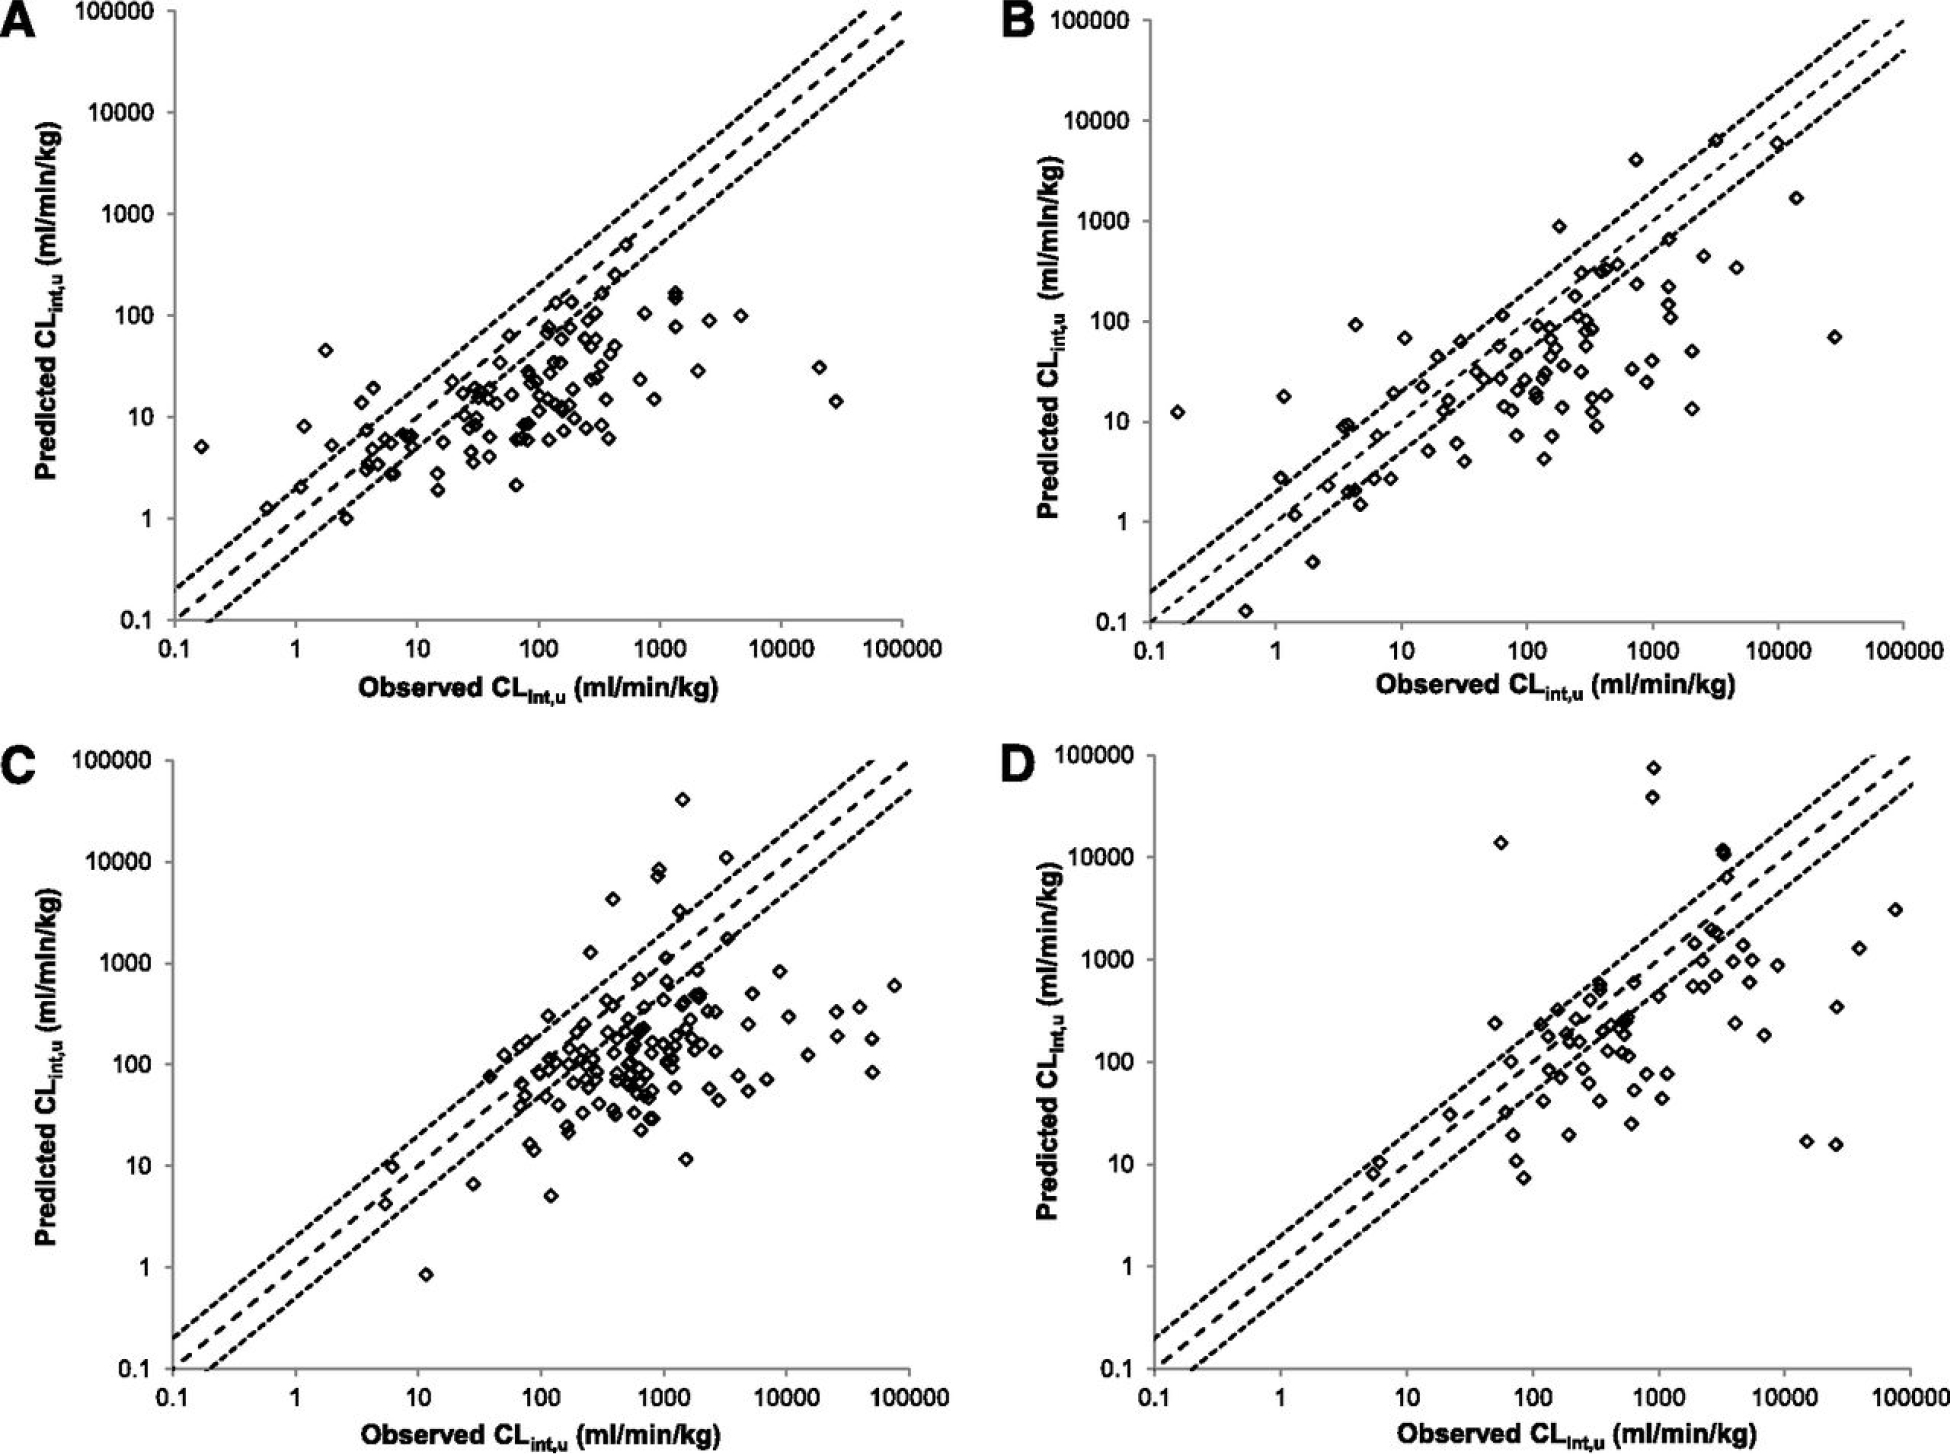
Prediction by Wood et al.3 of CLint,u in hepatocytes (A and C) and microsomes (B and D) in human (A and B) and rat (C and D). Dashed lines represent unity and dotted lines a 2-fold margin of error.
Official websites use .gov
A
.gov website belongs to an official
government organization in the United States.
Secure .gov websites use HTTPS
A lock (
) or https:// means you've safely
connected to the .gov website. Share sensitive
information only on official, secure websites.
Prediction by Wood et al.3 of CLint,u in hepatocytes (A and C) and microsomes (B and D) in human (A and B) and rat (C and D). Dashed lines represent unity and dotted lines a 2-fold margin of error.