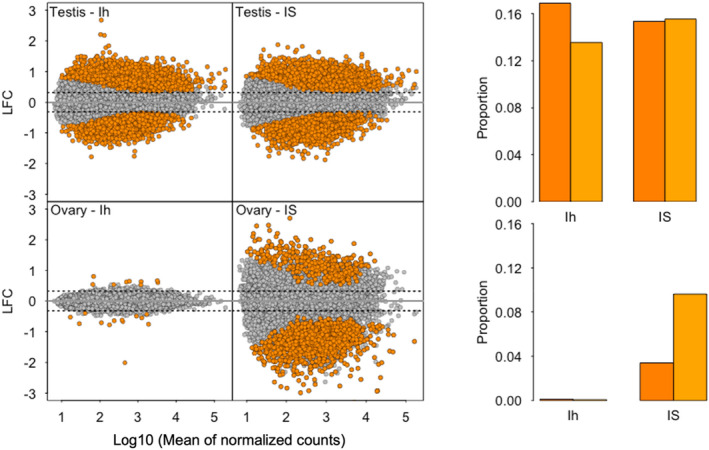
FIGURE 2.

Gene expression in Italian sparrow in comparison to house (Ih) and Spanish (IS) for testis (top) and ovary (bottom). Log2 fold change (LFC) is plotted as a function of the mean of normalized counts. Significantly differentially expressed genes are shown in orange and conserved genes in grey. Bar plots summarize the proportion of up‐ and down‐regulated genes. Dark orange: Up‐regulated, light orange: Down‐regulated
