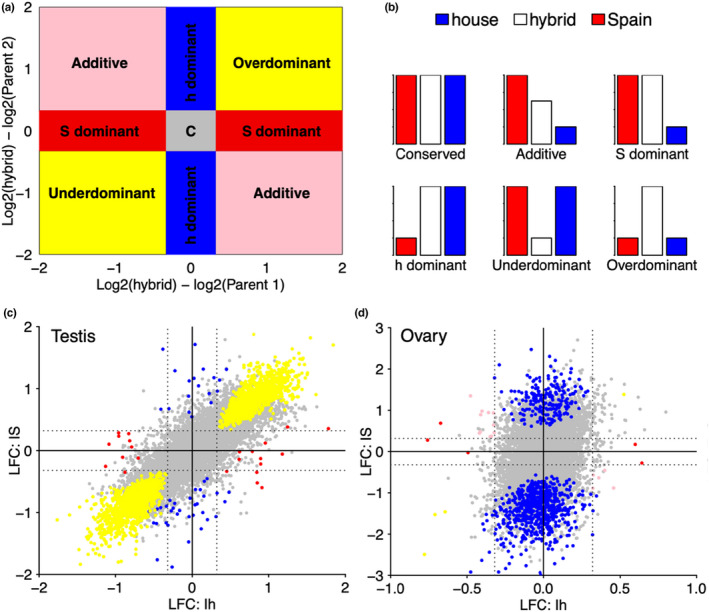
FIGURE 3.

Inheritance pattern of gene expression in testis and ovary in Italian sparrows. (a,b) Schematic figures representing the classification of inheritance patterns: House sparrow (h), Spanish sparrow (S). (c) Scatter plot showing shrunken log2 fold change (LFC) in testis between the Italian sparrow with the house sparrow (Ih) on the x‐axis and with Spanish sparrow on the y‐axis (IS), respectively. (d) Scatter plot showing shrunken log2 fold change (LFC) in ovary between the Italian sparrow with the house sparrow on the x‐axis and with Spanish sparrow on the y‐axis, respectively. Grey points in each graph depict the total number of genes studied for gene expression with those coloured representing the ones significantly different from parental species to be divided into each of the inheritance categories (conserved: Grey, additive: Pink, house‐dominant: Blue, Spanish‐dominant: Red, transgressive [over‐dominant and under‐dominant]: Yellow). Grey dotted lines indicate the log2 fold‐change threshold of 0.32 used for classification of inheritance categories
