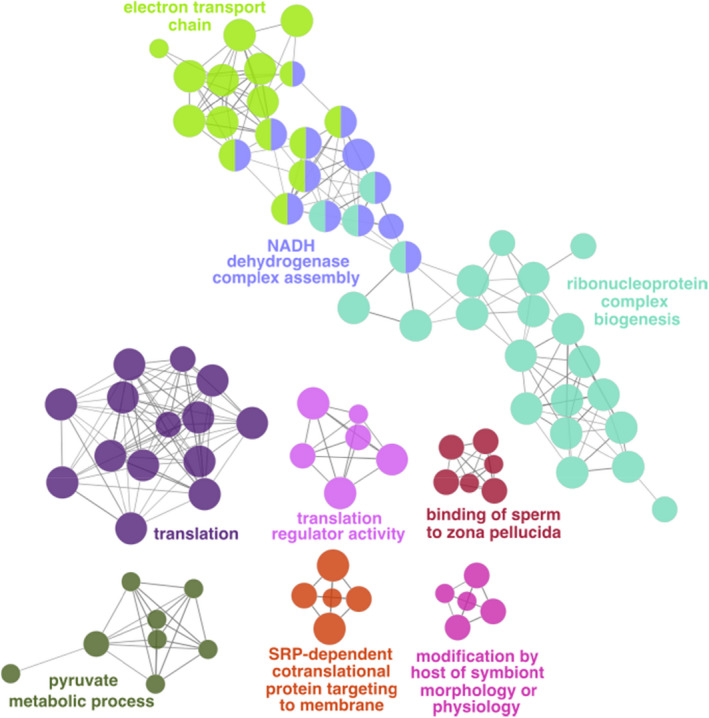
FIGURE 4.

Gene ontology network represented in over‐dominant genes in testis of Italian sparrow. Different colours depict significantly different biological processes. Circle size represents adjusted p value for each node with all p adj < .01 where node size represents the term enrichment significance
