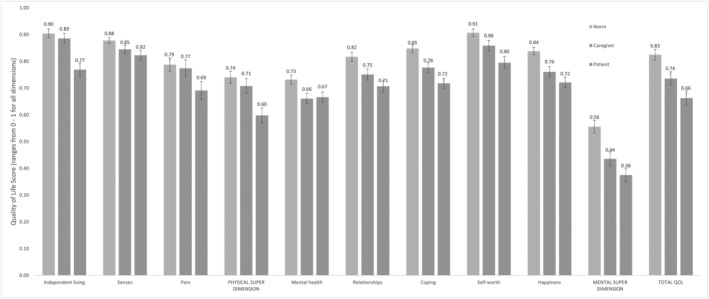
FIGURE 1.

Comparison of mean QoL across patient and caregiver groups and age‐adjusted (65–74 y.o) population norms (95% CI error bars)

Comparison of mean QoL across patient and caregiver groups and age‐adjusted (65–74 y.o) population norms (95% CI error bars)