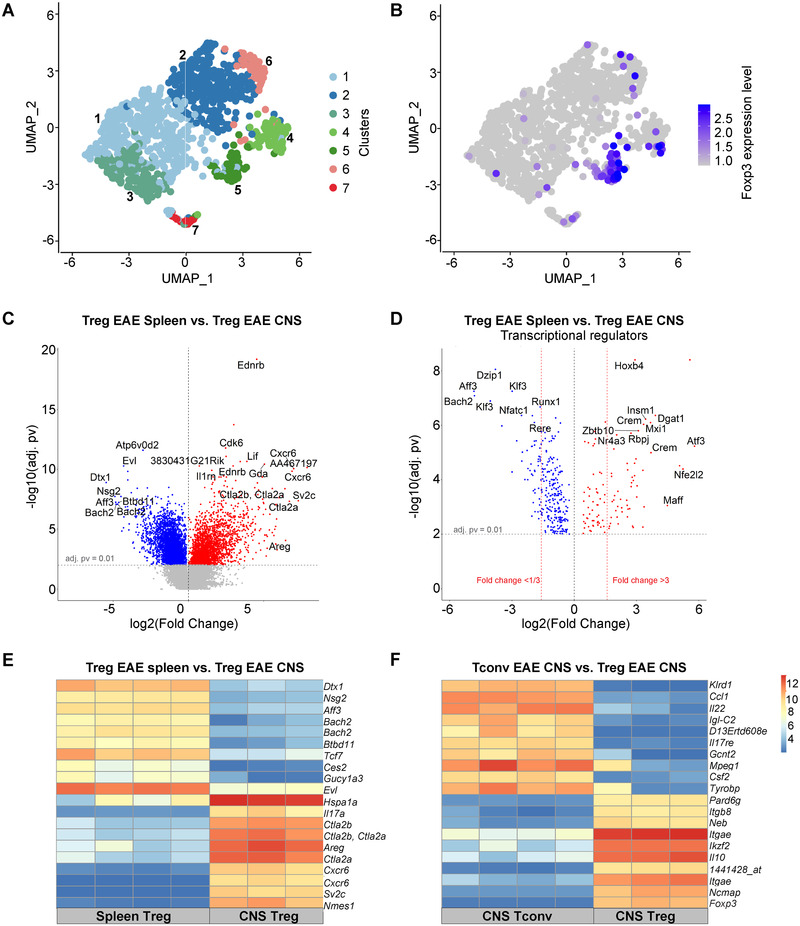
Figure 3.

Transcriptome characteristics of CNS Tregs. (A and B) CD45+ cells were sorted from the CNS of C57BL/6 mice at the peak of EAE (day 19) and analyzed by single‐cell RNAseq (10× Genomics). UMAP visualization of CNS‐infiltrating CD4+ T cells colored by cluster assignment (A) and by the expression of Foxp3 (B). (C to F) Tregs and Tconvs were sorted from CNS and spleen of Foxp3.eGFP mice at the peak of EAE according to the expression of CD4 and Foxp3 (Treg: CD4+Foxp3.eGFP+ cells; Tconv: CD4+Foxp3.GFP–). Samples (triplicates or quadruplicates) were hybridized to Affymetrix 430 2.0 whole‐genome mouse arrays. (C) Volcano plot showing differentially expressed genes between spleen Tregs (blue) and CNS Tregs. (D) Volcano plot showing a subset of genes shown in (C) corresponding to differentially expressed transcriptional regulators between spleen Tregs and CNS Tregs (E) mRNA expression levels of 10 genes most upregulated in CNS Tregs and 10 genes most upregulated in spleen Tregs from EAE mice, compared to each other. (F) mRNA expression levels of 10 most upregulated genes in CNS Tregs and 10 most upregulated genes in CNS Tconvs in EAE mice, compared to each other. Expression amounts normalized using the GCRMA are shown (Log2 transformed).
