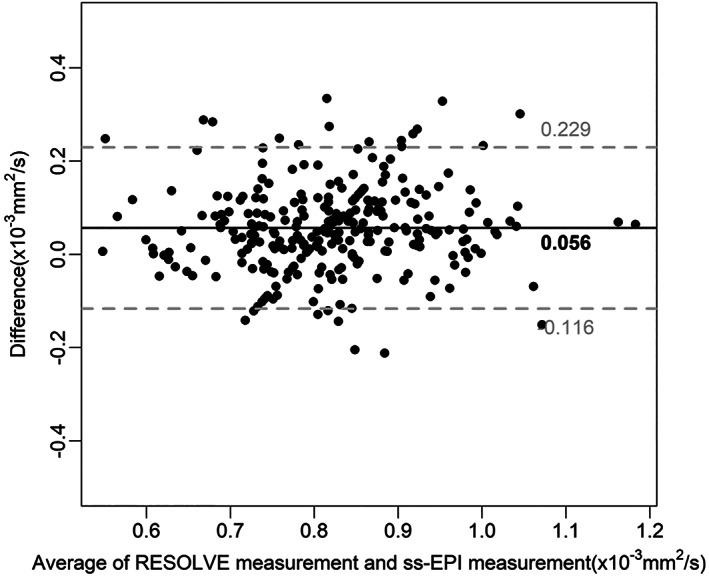
FIGURE 2.

Bland–Altman plots showing the agreement between the RS‐EPI measurement and the SS‐EPI measurement for all lesions. Solid horizontal lines represent the mean bias, and the top and bottom dashed lines denote the upper and lower limits of agreement, respectively.
