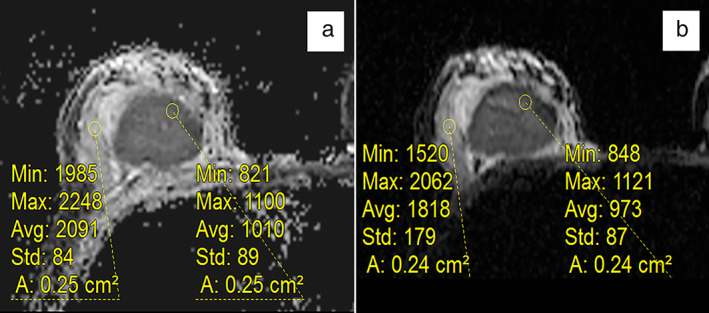
FIGURE 3.

Representative ADC images of normal background tissue and normalized ADC on RS‐EPI and SS‐EPI maps. The mean ADC value of the normal background tissue was 2.091 × 10⁻³ mm2/sec in the RS‐EPI maps (a) and 1.818 × 10⁻³ mm2/sec in the SS‐EPI maps (b).The normalized ADC was 0.48 for RS‐EPI and 0.54 for SS‐EPI.
