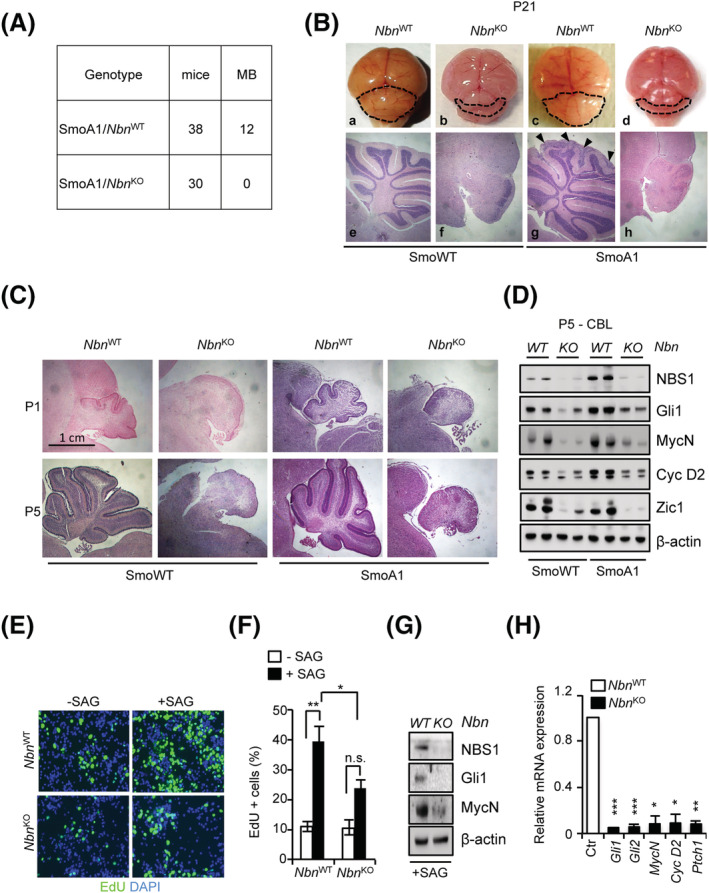
FIGURE 5.

Nbn KO abolishes SmoA1‐dependent medulloblastoma (MB) and cerebellar development. (A) Summary of the animals developing MB in SmoA1/Nbn WT and SmoA1/Nbn KO mice. (B) Representative images of the macroscopic features (upper panel) and haematoxylin/eosin‐stained sagittal sections (lower panel) of the brain/cerebellum from P21 mice with the indicated genotypes. Dotted lines highlight the size/shape of the cerebella. Arrows in box g indicate regions of EGL hyperplasia. Original magnification (4×). (C) Representative images of haematoxylin/eosin‐stained sagittal sections of the P1/P5 cerebella explanted from mice with the indicated genotypes. Original magnification (4×). (D) Western blot (WB) analysis of protein extracts from P5 cerebella (n = 2). Blots were probed with the indicated antibodies, and β‐actin was used as a loading control. Data are representative of at least three replicates. (E, F) Representative images of EdU staining (E) and percentage of EdU‐positive cells (F) in primary GCPs were obtained from SmoWT/Nbn WT and SmoWT/Nbn KO cerebella, treated with or without SAG for 48 h. Data are reported as mean (±SD). p‐Values were calculated by ordinary one‐way ANOVA test. (G) WB analysis of primary granule cell progenitor (GCP) cultures generated from SmoWT/Nbn WT and SmoWT/Nbn KO cerebella. Data are representative of at least three replicates. (H) qPCR analysis of the indicated transcripts in primary GCP cultures. mRNA expression levels were normalised on two reference genes (β2‐microglobulin and Hprt), and relative mRNA quantification was expressed as fold change (FC). Data are reported as mean (±SD). p‐Values were calculated by two‐sided Student's t‐test (*p < 0.05, **p < 0.01, ***p < 0.001; ns, not significant).
