
FIGURE 2.
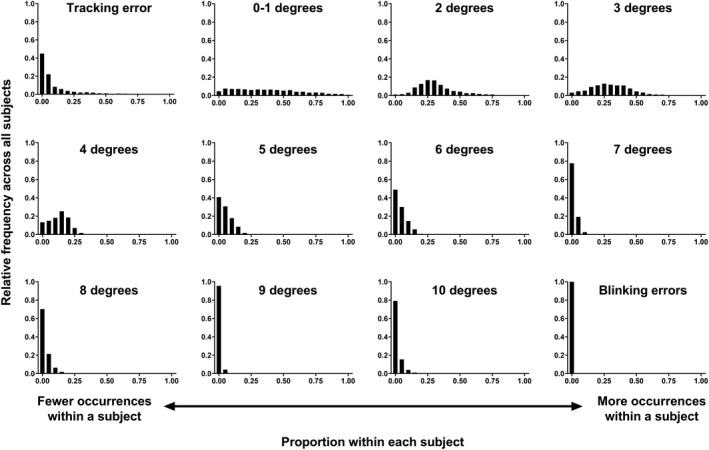
Frequency distributions (proportion across all subjects, y‐axis) of difference eye tracker outcomes as a function of different proportions of occurrences of those outcomes within each subject (x‐axis). A higher y‐axis value indicates more instances across all subjects, and a higher x‐axis value indicates more instances within a subject.