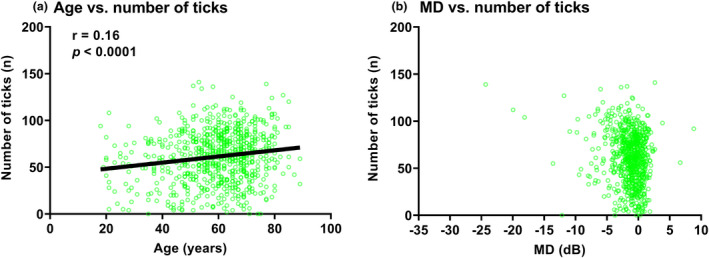
FIGURE 4.

Correlations between number of ticks and age (years, (a)) and mean deviation (MD) (dB, (b)). The datum points indicate the result from one of eye of one subject, and the black solid line indicates the result of the correlation analysis. The inset values are the correlation coefficient (r) and p‐value. As mentioned in the text, due to the wide distribution of data points in (b), the correlation results are not shown.
