
FIGURE 6.
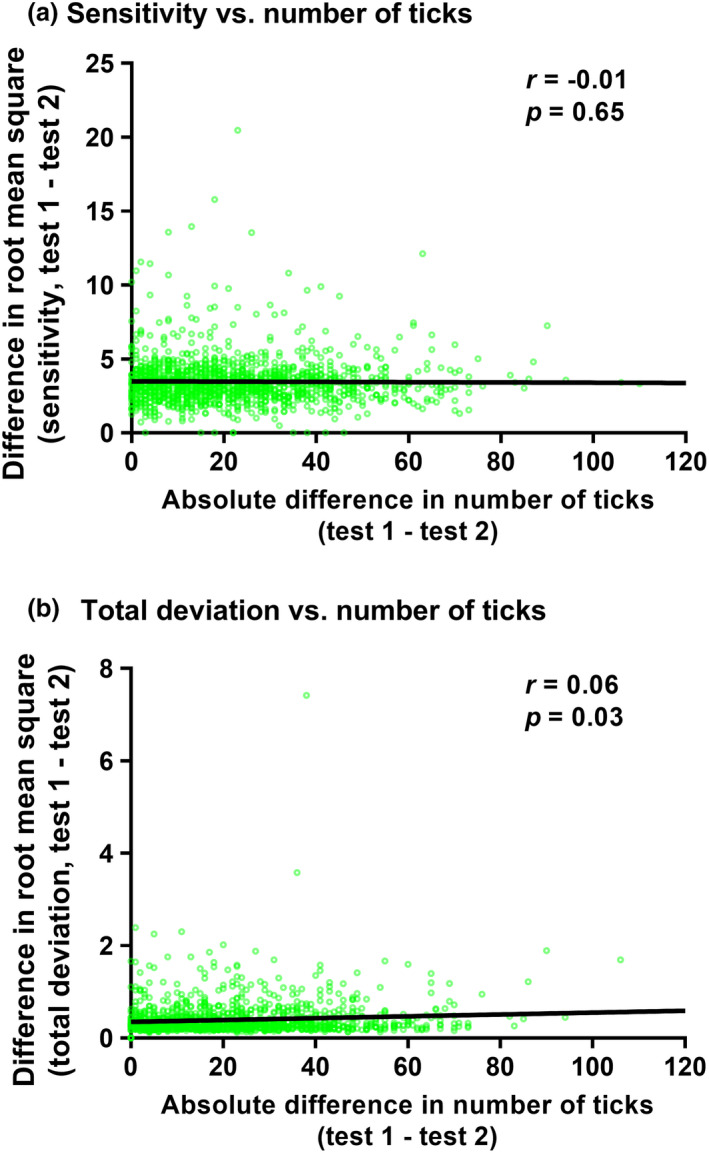
Correlations between the difference in root mean squared error in sensitivity (top row (a)) and total deviation (bottom row (b)) with number of ticks. All differences are test 1—Test 2. The datum points indicate the result from one of eye of one subject, and the black solid line indicates the result of the correlation analysis. The inset values are the correlation coefficient (r) and p‐value. Note that unlike in Figure 5, the differences have been converted to absolute values.