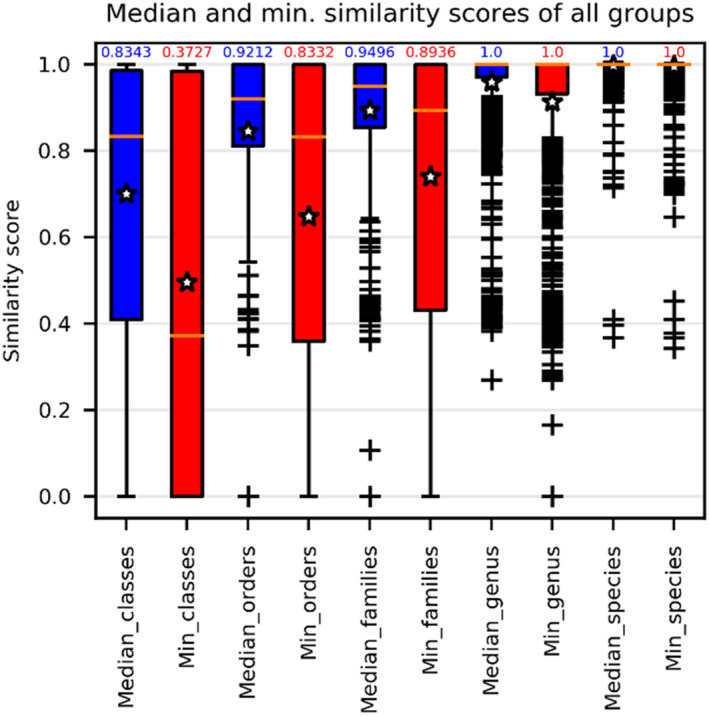
FIGURE 3.

The median (in blue) and minimum (in red) similarity scores computed for all groups of the reference filamentous fungal CBS ITS barcode data set at different taxonomic levels. The numbers above the bars are the median values of the associated similarity scores. The stars indicate the average values, whereas the horizontal lines indicate the median values of these similarity scores
