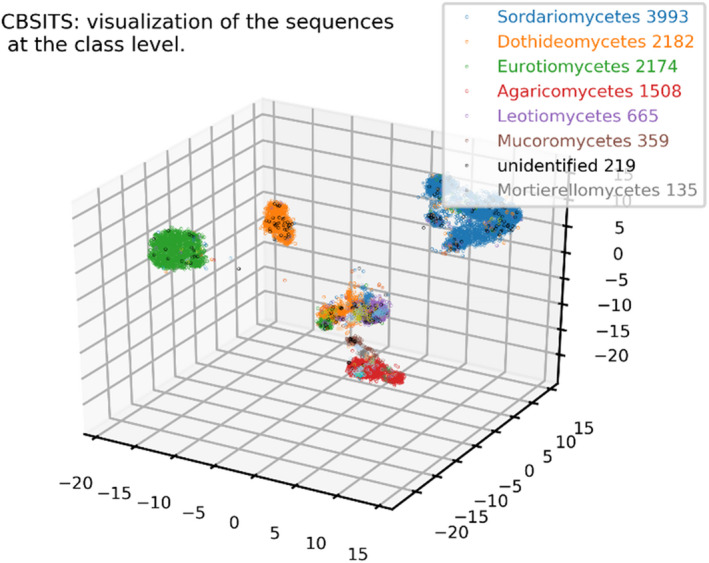
FIGURE 4.

The visualization of the sequences of the reference filamentous fungal CBS ITS barcode data set based on DNA sequence comparisons. Sequence comparisons were done using BLAST (Altschul et al., 1997). Based on the obtained similarity matrix, sequence coordinates were computed using LargeVis (Tang et al., 2016) and visualized using the mplot3d toolkit of matplotlib. The numbers on the axes are the tick values of the axes. Sequences were coloured based on class name. The unidentified sequences were coloured in black. The number of classes to display was set to 8. Note that sequences can also be visualized with DiVE, an interactive web‐based visualization component of fMLC (Vu et al., 2018)
